Manpasand Beverages (“Manpasand”). Manpasand is a Baroda based company which sells fruit drinks/juices under the Mango Sip and Fruits Up brands. In a short period, the company has seen rapid growth in revenues and profits. In FY16, Manpasand generated 557 crs in revenues and 51 crs in profits. This strong growth was achieved despite strong competition from dominant players like Coca Cola (Maaza), Pepsi (Slice/Tropicana), Parle Agro (Frooti) and Dabur (Real). Company Revenue grew at 5 year CAGR 60% and PAT grew by 70% CAGR. This kind of growth attracted many investors they raised money from Private Equity. They also issued IPO in 2015 and in 2016 they issued QIP. In FY 16, Parle Agro (Frooti) generated 1270 cr so that means the 30 years old company doing heavy expenses on marketing and sales distribution has just double the revenue of Manpasand Beverage which has negligible Marketing expenses. Manpasand claims they have presence in Rural states but as per the Survey conducted that less than 10% of retailer sell their products. Company also claims they have tie up with IRCTC but they were not yet approved to sell in premium trains. In FY 15 Manpasand launched its non-Mango products under the Fruits Up and Manpasand ORS brand. Fruits Up comprises (1) fruit-based carbonated drinks (apple, litchi, guava, orange and mango flavors) Fruits Up and Manpasand ORS together generated over 115 crs in revenues in FY16 in less than 2 years of launch. Parle Agro’s Appy Fizz (launched in 2005) was largely considered the clear market leader. However, if Fruits Up’s numbers are to be believed it is already larger than Appy Fizz. Appy Fizz has been heavily doing marketing expenses to gain market share and manpasand claims they are market leader in just a year without doing any advertisement expenses. Manpasand beverages were just showing in their books that they are paying 4.6 lakh per annum to management. Such a low compensation for senior management of this scale is bit akward.
The Curious Case of Kitex Garments
Kitex manufactures and exports infant garments and derives a majority of its revenues from export of garments to US and Europe. A part of Kitex’s revenues are from sale of fabric to a related party (Kitex Childrenswear) which also manufactures infant garments. Kitex has a concentrated customer base with its top 5 customers (likes of Gerber, Toys“R”Us, Mothercare, Jockey, Carter’s) accounting for over 80% of revenues. As seeing the ROCE of Kitex garments and Page industries it shows Kitex is world most profitable apparel manufacturing company. Kitex states that their 80% of revenue comes from 5 customer but Kitex accounts for less than 1 % of their total supplies. When the business was so much profitable and was earning 340 cr FCF there are majorly 2 ways company uses it by paying divided or by paying its Debt but company was doing neither of this two. The interest cost was rising for them but htye were noy paying as they stated they are making offset from their subsidy from Technology Upgradation Fund Scheme (TUFS) of the government. But in the books they have just collected 3,3 cr and yet to received 8.7 cr. Kitex does not earn interest on its cash balance and has not converted from $ to INR and as per the RBI no company can hold $ in their current account for more than a month. Kitex garments promoter has have a fully owned company under their private names. The company is Kitex childrenwear limited it is related party. KCL uses the same infrastructure , they have same customer , same product line ,same management. And ICRA in its credit rating uses both the companies to determine credit rating as they have strong liknage between both the business. In fact Kitex garments has formed 3 more private companies and atleast 2 of them have exact same business. And they are not merging the company inspite of having everything same business line. Kitex reports their audited results just after 3-4 days of the financial year ending. Practically it is not possible to audit a company in just 3-4 days. Kitex’s auditor is the Cochin-based Kolath & Co which does not audit any listed entity other than Kitex . While Kitex’s audited results demonstrate a high level of efficiency, its secretarial compliance reports show delays in its filings
There are various point I learned from this:
1)Revenue can be overstated or understated there should be reason of how company increase their revenue by new product line , Niche product , Volume growth , etc 2)Investor should have a good clarity in terms of their product supply chain how many distributors, retailers, stock points, warehouses. 3)Understand market size of their company segments and their market share in Industry and should have clear picture of their customers. 4)Management experience in their business segment and their compensation plans are also good indicator to judge efficiency of their work. 5)The linkage between any private company or any other company of promotor of director should also be checked. 6)One should also check background of company Auditor.
1) Growth – It can be organic (Selling more goods, raising the prices, selling new goods) or inorganic (buying another company). Growth can come from company specific or by Industry Specific (Industry is growing so your company is growing) and also check Incremental Market share how much your company can take from a pie. Here we need to look at four things – Historical growth 2) Sources of growth – There are various reasons like company can increase it product price or by selling more volume. Increasing price can come from various reason niche products/No Substitute Available/Higher Quality product etc. Company has to grow from selling higher volumes when there game of cost cutting because manufacturing more volumes can lead to lower cost. 3) Quality of growth – If earnings growth outpaces its sales growth over a long period of time, you need to dig in the numbers to see how company keeps squeezing out more profits from stagnant sales. (by company power to control which cost) Sustainability of growth in the future Profitability 4) ROA – It shows much return the business is making on its assets. It has two components – Net margin and Asset turnover. There are businesses like grocery stores which have low margins but then they try to turn over their assets quickly which can help them to have superior ROAs. On the other hands, businesses like luxury retailers, have low asset turnover but high margins. 5) ROE – It measures the efficiency with which the company uses shareholders equity. It has three components (Du pont) – Net margin, Asset turnover and Financial leverage. Here we need to look out for the third components i.e. financial leverage. Companies can boost their ROEs simply by taking on more debt (financial leverage). In the current years ROE will shoot up but in latter years due to very high interest outflow Net profit margins will get affected and can lead to Lower ROE. 6) Free Cash Flow (FCF) – It is arrived at by deducting Capital expenditure as well as Lease Payments (If company has lease liability) from ‘Cash flow from Operations after Working capital changes’. It is the excess cash that really belongs to the shareholders. To analyze it, we can divide FCF by Sales to see how much free cash flow the company is generating from every Re.1 of sales. This can be negative and positive also but for one two years negative is reasonable is company is heavily doing CAPEX but after some years it should be positive. 7) Return on Invested Capital (ROIC) – ROIC improves on ROA and ROE because it puts debt and equity on equal footing by removing the debt because ROE can look good due to Heavy financial Leverage. It is calculated as – “Net operating profit after taxes (NOPAT) divided by Invested Capital(Core FIxed Assets plus Working Capital)”, where NOPAT is Net income after taxes but before interest.
Other metrics to check financial health of a company –
1) Debt/Equity – It is calculated as Average Total Debt/Total Equity. Average Total Debt ( Long term Debt plus Short term Debt Divide by 2) It helps us to measure how much company has Debt per dollar of Equity. 2) Interest Coverage Ratio – It is calculated as Cash flow from Operations Divided by Total Interest Expense. It helps us to understand how much times company can pay its Debt obligations. 3) Current Ratio – It is calculated as Total Current Assets divided By Total Current Liability. It helps us to understand how much cash company can raise in order to pay its liabilities.
Bear Case
Construct a convincing a Bear case 1) List all the possible negatives of the company/business 2) What could go wrong if a company is not able to grow? 3) What if no one buying there are only seller for this company. By doing this you will have the confidence to hang on to the stock during a temporary correction patch.
Analysing A Company Management
Excellent Management can make the difference between Mediocre business and outstanding one, a poor management can run a great business into the ground. There are few examples A great management of Garware Technical Fibres this company was taken over by the son of the old management. He than just turn the company into a outstanding business. Sometimes it is better to check how much is management skin in the game by taking look at ESOP structure. Management can be analysed as following: 1) Compensation Bonuses should be preferred over big base salaries because bonuses are dependent on certain performance targets being achieved. These performance targets should be clearly disclosed. They should make the company bigger with better. Compare the company’s management compensation with its peers after due regard to the size of the firm and its financial performance. (Management compensation as % of PAT is an important metric to check) Is the company loaning the money to its managers? If yes, at what interest rate? And is the loan finally repaid? Also check if management is giving loan to company reasonable rate or higher rate than Bank. Does the management excessively use the stock options and dilute the equity of the company? Does the management immediately sell the shares of the company after they have been granted options? Also check the relatives of management are using luxurious travelling at Company expenses. Check if a company is taking huge amount of bonus and salary and not dividing them between shareholders. 2) Character Study related party transactions in detail because here the game is really confusing company is doing transaction with promoter fully owned company also. Is the board stacked with managements family/friends? Does the management honestly discuss its poor decisions and performance? Does the management provide enough information to properly analyze the business? 3) Operations Look for high and increasing ROAs and ROEs. Are ROEs increasing due to excessive leverage? Does the management allocate its capital efficiently over the years? Because company can allocate or acquire another company and paying goodwill but in next two years company declares the acquired company is not worth it so writing off goodwill. This can happen one two times but again again doing this stuff by management should be studied. Is the management diluting too much equity? Do the actions of the management match with what they claim to do? For example company is saying there are planning to build a new plant are they achieving their target as per their time they disclosed over the years.
Consumer goods
Companies that are into selling consumer goods are defensive during economic downturn because people will use soap and toothpaste. Consumer Sector is considered of Foods & Beverages, household , personal products, Affordable housing and habitual goods. Like it economy is doing great or not this companies are never been seen down but it grows slowly. Consumer goods companies manufacture their products and sells to distributor and they sell to retailers and finally it reaches to consumer. Key Strategies for Growth- Because of Maturity this sector has gone through periods of consolidation. Most industries are dominated by higher volume and sales. Companies try to gain market share by introducing new products. And if your company is selling to another company like for retail store if they see that this category of products is selling more so they try to manufacture this kind of similar products and keep them in shelf and not keeping the old products so this can be a risk also. Growth can also come from Acquiring other Consumer goods company. This can prove to be successful of a company or it may not work like the expectations. Like Pepsi Co acquired Quaker Oats turned out be best investment for them. But Gillette bought Duracell battery did not worked out form them. The main game in Consumer goods companies is the distributors and retailers. They should have very good relation with them and distributors should be across regions. Another important metric to look at is operating cost. Is company being able to reduce their operating cost like company hiring more contract labours can be a good signal. Costing cutting can also be sometimes lead to downturn of company because there are certain cost that cannot come down to zero. Company should also focus on Marketing & Advertisement expense to increase their revenue. There are various risk investors should look in this sector Increasing power of Retailers: Because it is the retailer that finally sell products. Lets say Walmart now everyone wants their products to be in Walmart stores which means they have complete control on pricing. And also the local retailers cannot buy in huge volumes so they cannot buy at what Walmart is buying and cannot pass the cost to customers. Litigation Risk: This risk is mainly with Tobacco companies, government has full authority to shutdown such business. But ITC enjoys this because other companies cannot sell tobacco due to government not giving license to other players.
Economic Moat in Consumer Goods Despite the risk , one very attractive feature of this is competitive advantage that helps in preserve pricing power. 1) Economies of Scale 2) Big powerful Brands Distribution channel and Relationships Hallmark of Success in Consumer Goods 3) Market Share – Companies that hold dominant position are likely to stay the same just small shifts year on year. 4) Free Cash Flow – In The mature sector company has tons of FCF. Companies because of their wide MOAT. 5) Belief in Brand Building – Firms that consistently make Advertisement expense and other non-sales communications and giving high quality will build up a perceived value. Check out whether companies is giving huge discounts to gain market share. Companies should not cut advertisement expense when sales aren’t going well. Innovation – Companies should have great order pipeline to stay competitive. Check out whether the company is introducing new substitute or a Revolutionary product that never existed.
Industrial Materials
Industrial Material companies buy raw material and manufacture product/machinery so that other firm can use it to fulfil customer demand. Industrial material are of two types 1) Commodity product – Steel , Cooper 2)Value Added product – Heavy machinery , speciality chemicals. In commodity product no one has control over its price but in value added product one can charger higher price. Some industries perform according to the economic performance of the company because of which many companies are unable to survive during the recession. Some of the economic moat for basic material industry can be value added products, pricing, brand effect, etc and for industrial materials might be how efficiently the company is able to use their assets, technology advancements, competitive advantage, etc but the economic moat can be different from industry to industry. Some industry are cyclical when there is boom in industry all the price of inputs, revenues just go up when a downturn comes only those companies survive that has lowest cost to manufacture product in commodity products. Some cycle are long and short depending industry to industry Rise of capital through debt which might have a negative impact during a downturn, pension during the slow/no growth of the company can might have a negative impact on the company, the attempt to capture large market size with due to which low total asset turnover and fixed asset turnover can be bad indicator. To Indentify best industry in industrial material look for which industry has gone through major consolidation. Then look for lowest cost producers and additional revenue streams through valued added category.
The company’s fundamentals have a direct effect on its stock price. Over the long run, as the business grows, so do the stock prices. And as the business suffers so do their stock.
Long-term approach. But why?
First of all any business to take a pace of growth it take long time to built up.
Stock prices in the short term can move around due to reasons which are almost impossible to predict. Like any calamities , strikes, increase in Raw material price due to shortage, etc. In short term Stock price can go 50% or 50% in negative but when you see a good business for long term its always growing at reasonable rate but for long time.
Trading involves a lot of transactions which drives up the transaction costs and taxes. Which in case you yourself are not making much profits but your are making profits to your broker and government through trading.
And most importantly, investing for the long term gives us the benefit of compounding. Because earning Simple Interest is easy but to earn Interest on principal plus accumulated interest is where the game changes.
Independent thinking
A common quality of successful investors is the steadfast ability to think independently. Don’t be swayed by any expert its better to take their idea and have proper due diligence and reasonable basis on our research. Graham and Buffet often point out that if your reasoning is right, that’s all you need to worry about. Investment success depends on personal discipline whether or not the crowd agrees with you.
There are majorly 5 Rules to follow while Investing:
1.Do your Homework:
Investors commonly make the mistake of not studying the company thoroughly before investing. Some investor buys a stock because a Bigger player has also bought but they don’t know his risk appetite his timing at what price he bought or when he will sell why he bought because even they can make mistake so its better to have your own analysis. Spending time to research about the company by reading its annual report, understanding the competitive environment and going through past financial statements is extremely important as it can uncover a lot of facts which ultimately prove the investment to be poor. Unless you know the business inside out, you shouldn’t buy the stock. Because While investing you should think independently should I do this business at this growth so if your are comfortable while doing this business and you know thorough business so why not to invest in this business this should be your aim.
2.Find economic moats:
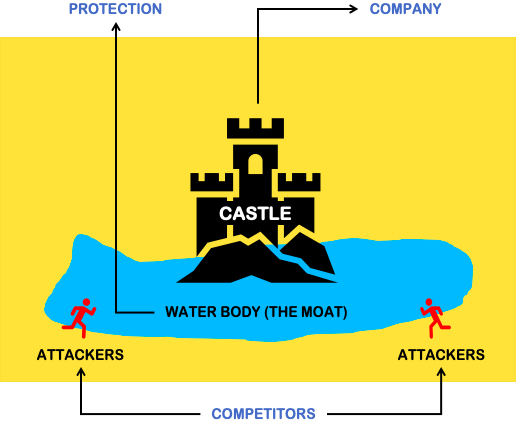
The word moat was used in medieval times for a huge water body surrounding a castle to defend it from invaders. Economic MOAT is one of the cornerstone concepts of value investing. The term economic moat is used to describe a firm’s competitive advantage over its peers, which helps a business from being taken over by the competitors. Because In any industry, the highly profitable companies tend to become less profitable over time, as other firms enter the market. In this scenario, an economic moat is what helps the company to sustain above average profits over a long period of time. There are 5 ways companies can create Moat. Brading, Patent, High barrier to entry, Innovation, High switching cost.
3.Have Margin of Safety:
This is by far the most important rule among all the five rules of successful stock investing. Finding a great business is just one part of successful stock investing, the other part is assessing the true worth of the company. Because every investor wants to buy a stock less than its intrinsic value. Benjamin Graham in his book “The Intelligent Investor” said “if you pay too high price for a great business, it’s still a poor investment”. Therefore in cyclical industry/small cap investor should have greater margin of safety and in stable business one should have decent or low margin of safety.
4.Hold for long haul:
Every investor must remember that a stock is not just a ticker blinking on the screen, every stock has a business behind it, and when you buy a stock, you buy a part ownership in the company by paying your hard earned money. Thus every stock purchase should be treated as seriously as buying an part of business. Trading in short term can create a hurdle in your return and you have to work more hard to try to compensate it. For every brokerage or taxes you pay while trading can also give you better return in compounding if you don’t trade often. Like every ₹ 1 you pay as commission/taxes can give you ₹ 5.47 (assuming CAGR of 12% for 15 years).
5.Know When to sell:
A lot has been said about when is the right time to buy a stock, but very little is said about when is the right time to sell a stock. Although one should not sell any stock as long as the fundamentals of the company are intact, there are times when you feel that the investment you made may not last forever and at some point it becomes necessary to exit that stock. Short term price movements can be in any direction but it doesn’t portray clear picture.
There are various metrics to ask/check while selling a stock:
If your initial analysis was wrong or you missed something.
The fundamentals have deteriorated
Stock price has risen too far above its Intrinsic Value.
There is something better you can do with the money.
If the stock carries too much weight in your portfolio.
Investing is pretty simple Unless you know how to avoid the most common mistake of investing, your portfolio return won’t we anything to get excited about.
There are seven easily avoidable mistake that many investors frequently make:
Loading your portfolio with all-or-nothing stocks E.g. Small growth stocks in many cases. This is also the case when buying a great business and giving it more than 90-95% weight in portfolio. But when a heavily weighted stock goes 50% down you need to earn double the return just to breakeven.
Believing that its different this time. History does repeat, Bubble do burst , not knowing history is a major handicap. Suppose a cyclical stock has been giving decent return to an investor as market is very optimistic but when downturn comes that stock again goes to -50%.
Falling in love with products – Great products do not necessarily translate into great profits. When you look at the stock, ask yourself, “Is this an attractive business?” “Would I buy the whole company if I could”. If the answer is NO, give the stock a pass, no matter how much you like its products. Suppose a company says it has created a significant product but that product might be selling at low margins than what is the use of creating new product.
Panicking when markets are down. Stock are more attractive when no one wants to buy it. It is generally said as the time of pessimism is the best time to buy the stock.
Trying to time the market – It is one of the greatest myths of investing. Even if u look into a great business lets say you are trying to time the market and you bought a stock at peak in 2010 and that time was the starting of downturn in market then later on in 2015 that stock comes at breakeven at your bought price so net you realised 0% return in 5 years.
Ignoring Valuation – The only reason you should ever buy a stock is that you think the business is worth more than its selling for, not because you think a greater fool will pay more for the shares a few months down the road.
Relying on earnings for the whole story – In the end, cash flow is what matters, not earnings. Because earnings can be easily manipulated as compared to cash flows. It’s the accounting technique use to pump the revenue and report higher profits but reality is that profits in cash or just paper profits. Check the trend of accounting earning if it is growing and simultaneously CFO is not increasing over the years than one can detect a spoil in business.
Economic Moat:
It is said that big gets bigger. The basic principle of free market is to invest where there is higher returns so if business or industry starts to grow at higher rate it attracts many firms and they enter in these business to take the advantage and the profits are divided into small parts so no one can get major benefit. But some firms generate higher return due to their characteristics called as MOAT. Why do Pharma company has major expense in R & D and lawyers expenses because they doesn’t want any loophole in their patent of their drug. So that they can generate higher profits with no/less competition.
Economic Moat can be analyzed by:
Has the firm been able to generate superior ROA and ROE historically and if yes will it be sustainable in future.
What is the source of its profits? How the company is able to keep competitors from stealing its profits? How it has create strong entry barrier?
Analyze the competitive structure of the industry. How do firms in the industry compete with each other? What is the competitive advantage of company?
Estimate how long the firm will be able to hold off competitors.? And how?
Evaluating Profitability:
First step to is to check its Net margins by examining its financial results. Check whether the firm generates enough Free cash Flow? And how much?
Free cash flow basically is what is left after reinvesting into business from profits. Next step is to divide it by Revenue to analyze how much portion of revenue is been converted into excess profits.
Calculate ROA and ROE. ROA tells us that how efficient is firm able to convert Assets into Profits. And ROE tells that how much profits are earned on shareholders money. Look at all the metrics combined to verify whether firm has MOAT or not by analyzing Good Free cash flow , solid ROE and decent and sustainable margins over the years.
Building Economic MOAT:
It is important to understand how company has been able to keep competitors at bay while earning excess profits alone. Ask question like why Competitors cannot sell below their selling price? Why they are not been able to steal customers?
There are five ways company can create sustainable competitive advantage:
Creating Real product differentiation through superior technology or features
Creating Perceived product differentiation through branding and reputation
Driving costs down and offering the product at lower price
Locking in customers by creating high switching costs
Locking out competitors by creating entry barriers and success barriers
Example of MOAT in Indian Companies are:
Asian Paints – They currently are India’s largest with a market share of almost 40%. It is also Asia’s 3rd largest paint company. In addition, the company has also maintained a good track record for consistent growth.
Shree Cements – One of the biggest moats the company has set for itself has been its low production cost in the cement industry. The company has an EBITDA/tonne of Rs. 933/tonne whereas the industry average stands at only Rs 692/tonne.
Pidilite – Their brands include FeviKwik, Dr Fixit, M-seal, Acron etc. Their leading brands have a 70% market share in the Indian adhesive and industrial chemical market. There are very little competitors can do when accompany owns such a large portion of the market.
D-Mart – They have 234 stores across country. Due to their size, they are able to generate huge volumes of sales which allows them to negotiate the price of products at a cheaper rate from suppliers when buying in bulk. This results in products sold at lower costs in their stores in comparison to other competitors.
How money flows through a company?
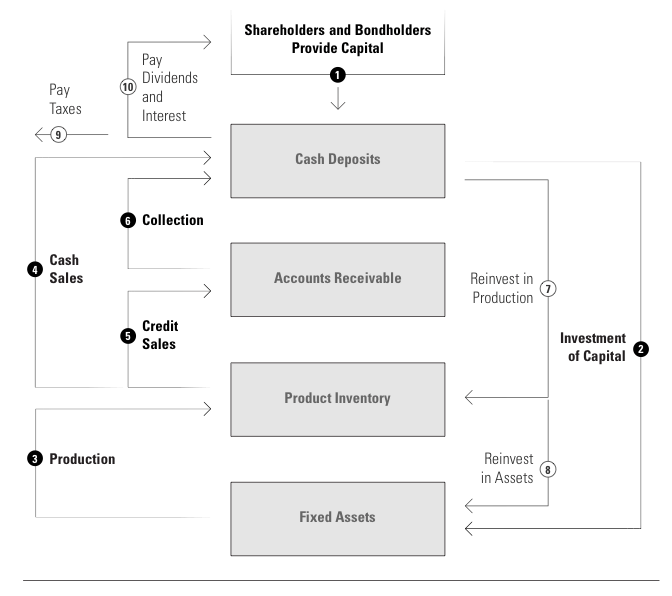
The basic flow of money in every company is almost same. First A group of investor(Equity & Bond holder) provide capital to run business. Investor buying stakes in firm are Equity investors and Investors giving loan at certain rate are bondholders. Then the money is used to buy Fixed Asset (Plant & Machinery) this helps in producing Inventory. Some inventory is sold for cash and some on credit called as Revenue. Credit sales are recorded as “Account Receivables” and the cash sales is used again in production process which means buying more machinery more raw material, etc and some is used to payoff debt and some used to distribute profits among shareholders after Paying Taxes.
Copper climbed to the highest in almost a decade as the global recovery from the pandemic extended a rally in metals markets. Three-month copper on the London Metal Exchange rose to $10,040, its highest level since February 2011 when the contract hit a record high of $10,190 a tonne. Aluminium advanced to $2,438 a tonne, nickel increased to $17,855 a tonne and tin climbed to $29,465 a tonne. There are various reason for surge in copper price. Governments around the world have pledged to reach zero net carbon emissions by around mid-century, while the US rejoining the Paris Agreement late last week signals President Joe Biden’s administration’s emphasis on tackling climate change. This has helped drive demand for copper, as well as green energy initiatives that are sprinkled throughout President Joe Biden’s $2.2 trillion infrastructure proposal. Copper, which is used in wiring, is expected to benefit from greater demand for electricity in a shift away from fossil fuels. In addition, a larger portion of future power generation is expected to come from renewable energy such as wind farms, which use more copper. Copper is increasingly needed in the production of electric vehicles, which require close to 200 pounds of the metal in a single vehicle. Gas-powered vehicles on the other hand only require about 20 to 50 pounds of copper. UK-Australian firm BHP last week said it has a positive demand outlook, which is by growing exposure to the global trend towards electric batteries. Another main reason is that Copper production declined in 2020 due to government restrictions and lockdowns during the Covid-19 pandemic. The world’s largest copper producers, Chile and Peru, were hit especially hard by the pandemic, which could impact supply. In the near-term, mined copper production has been impacted by the Covid-19 pandemic in Peru, the world’s second-largest producer. Mined copper production in Chile, the largest global producer, was largely unaffected in 2020 by the pandemic. But Port workers in Chile, are scheduled to begin protests over President Sebastian Pinera’s move to block a bill allowing people to make a third round of early withdrawals from their pension funds. Earlier this month, prices spiked following Chilean border closures related to the pandemic. That’s coming alongside a continued economic boom in China, where a push to reduce carbon emissions is taking place. Some manufacturers and end-users have been slowing production or pushing back delivery times after costs surged, while weaker-than-expected domestic consumption has opened the arbitrage window for exports.
India’s second largest private bank by market capitalisation just saw its quarterly net profit jump ICICI Bank reported 104 per cent increase in its standalone net profit for the financial year ended March 31, 2021, at Rs 16,192.68 crore. The private lender had posted a net profit of Rs 7,930.81 crore in the financial year ended March 31, 2020 Net interest income, the difference between interest earned and interest expended, for the entire FY21 increased by 17.2 per cent. On March 31, 2021, the bank held aggregate COVID-19-related provision of Rs 7,475 crore,” ICICI Bank said in its filing. ICICI Bank Domestic loan book rose by 17.7% amounting to ₹7 Lakh crore and retail loan book rose by 20% amounting to ₹4.9 Lakh crore at the end of March 2021 mainly driven by strong traction in mortgages, auto and business loans. In the same case the leader HDFC domestic loan book rose by 14% amounting to ₹11.3 Lakh crore and retail loan book rose by 6.7% amounting to ₹5.3 Lakh crore. This outperforming growth in ICICI bank is seen after long time , first time was seen in Mid 2000s. ICICI Bank’s total capital adequacy on March 31, 2021, was 19.12 % compared to the minimum regulatory requirements of 11.08 %. In the past asset quality cycles, margins were very low at sub 3% and provision coverage ratio (PCR) was low at around ~50% vs. ~3.7% margins and PCR of ~78% today. Is ICICI Bank back to its old days of aggressive lending considering such a strong loan growth has happened during a very tough year? We do believe that ICICI Bank has been cautious in this cycle largely lending to secured assets and well rated corporate loans
On the other hand, HDFC Bank’s struggles with its online banking has been a recurrent theme. Hardware challenges have caused repeated app outages and moving to cloud could take 12-18 months, according to analysts at Nirmal Bang, another Mumbai-based broking firm.
Market regulator Securities and Exchange Board of India (SEBI) issued a circular stipulating that minimum of 20% of the salary of the key employees of asset management companies (AMCs) must be paid in the form of scheme units in which they have a role, in an obvious attempt to make them more accountable for their investment decisions and it shows the confidence towards investors. The provisions of this circular shall be applicable with effect from 1 July 2021. This announcement has come following news reports that some of the key employees of Franklin Templeton AMC are selling their investments held in the schemes that were closed ahead of closure. The circular indicates that the 20 percent payout that would come in the form of scheme units is as a percentage of the gross salary less of income tax deducted and other statutory contributions like Employees Provident Fund and National Pension Scheme. To maintain the guideline, SEBI has mandated that index funds, exchange-traded funds, overnight funds and existing close-ended schemes will be excluded from unit allocation. If the employee retires at the age of 60, then the units (excluding units of closed-ended schemes) can be redeemed. The units cannot be sold if the employee resigns or retires before the age of 60 years. This circular applies to not just senior employees but junior research staff, dealers, and support function heads. These people don’t earn the kind of money CEOs and CIOs do. It is forcing them to lock 20 per cent of their income for 3 years. It mandates how much one saves. For an employee earning 15-20 lakh, imagine how difficult it is to put away Rs 3-4 lakh. They are blocking their cash flows. The circular says that units allotted to the key employees shall be subject to clawback in the event of violation of Code of Conduct, fraud and gross negligence by them. “Upon clawback, the units shall be redeemed and amount shall be credited to the scheme,” the circular says. The gap in the circular is that it fails to state that the clawback will work only during the lock-in period. How will the clawback work after the lock-in ceases and key employees begin redeeming their scheme units? This is yet to be cleared.
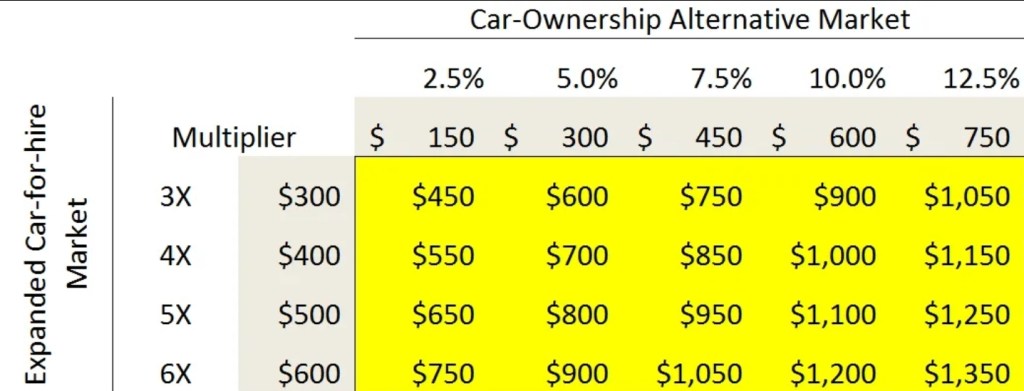
Aswath Damodaran, a finance professor at NYU’s stern school of business has published “Uber isn’t worth $17 billion” Damodaran concluded that his best estimate of the value of Uber is $5.9 billion, far short of the value recently determined by the market. This estimate of value was tied to certain “assumptions” with respect to TAM (total available market) as well as Uber’s market share within that TAM. For the base case he assumes that primary market for Uber would be global taxi and limousine market. For that he took estimate of $100 billion on historical basis of global taxi. And he assumed 10% market share Uber can capture. He assumed future will look like past and also assumes that Uber will have zero impact change in car for hire market. But this assumption is flawed with various reasons when a new type of technology is launched in market as per the customer preference it actually expands the market in process. Uber is far different market than car for hire market. Features of Ubers different from Taxi’s: Faster Pick-up time: The pickup time is far more faster than normal taxi because the app locates the nearest Uber to book your service. Coverage density: Internet has made it possible to reach every corner of the world and by the help of this Uber has vast coverage across globe. Payment: This is fast process by using its own wallet or through online payment which is less time consuming than traditional method. And additional cashback and discounts coupons have also attracted most users. Tracking: This feature has made Uber different from normal taxi service and it has also increased the trust on users because they can track every moment of their cab in the app right from pick-up point to destination. Uber has reached a point where owing a car is expensive than using Uber because of its service charges. But more importantly, America’s youth have fallen out of love with the notion of owning a car. Kids are no longer rushing to obtain their license on the day they turn 16, and according to Edmunds, car ownership among 18-34 year olds has fallen a full 30% in recent years. How big is the car-ownership-alternative market? The number of cars in circulation in the world is just over 1.5 billion in that 25% are in US and 75% in rest of the world. Car comes with fixed cost and variable cost like DMV registration, insurance, depreciation are fixed and price of oil and gas are variable. The average cost is around $9000/year in US and $5000 in rest of the world on approx. basis. So multiplying the cost with number of cars we can get average total cost annual for car i.e 375 million cars in us multiply by $9000 that comes to $3.3 trillion and in rest of the world $5.6 trillion that sums up to $8.9 trillion annual cost for owing a car and lets say Uber can capture 25% market than it TAM comes out to be $2.25 trillion. But this all comes with assumptions. There are other economies of scale that come with being the market leader. When you consider that Uber is partnering with smartphone vendors, credit card companies, car manufacturing companies, leasing companies, and insurance companies, you can imagine that being larger is a distinct advantage
Combining these two opportunities, you end up with a potential range of new TAM estimates from $450 billion all the way up to $1.3 trillion. According to Aswath Damodaran valuation is around $100 billion for car for hire market. But considering the high growth in the number of users, rides we consider that Uber is 25x and hence that comes up to be around $250 billion. Now that Uber if valued at $250 billion, what market share would we get considering the market sizes that we calculated earlier after the multiplier effect.
There are many biases that can come into play when making estimates. For example, as an investor and board member at Uber one might conclude that I am biased to see things in a more positive light.
This article focuses on economics and politics & different Internet Models that run around the world. The use of Tech is worldwide and this business have marginally low cost and can be easily sold through internet. But sometimes to make use of this type of services in international countries comes with restrictions. Different type of licenses are required, taxation policies, Duties, etc. The U.S Model This is the best model because this model allows every country to use their space with low barriers to entry and with few restrictions. Winners: Large U.S. tech companies operate freely in the U.S., giving them a large and profitable user base to fund expansion abroad. Low barriers to entry The U.S. government collects the vast majority of taxes from US & Non-US tech companies Minimal restrictions on collecting data for US & Non-US tech companies Non-U.S. companies are free to operate in the United States without restriction, and in other countries that follow the U.S.’s approach. Losers: Non-U.S has limited control over US tech companies.
China model This model is the strictest model which has lots of restrictions and censorships and does not allow majority of tech companies in their country. So it becomes difficult for other companies to expand in densely populated country. China is the only country which is rivalling the U.S. for the size and breadth of the internet companies. This is because of massive internet market in China and lack of competition. China has created great firewall for companies like YouTube, Gmail, Google Play, Google Maps, Google Drive, Hangouts, Blogger , Twitter , Snapchat , Discord , etc . But it is seen that Chinese citizens are using these by using VPNs . European Model Europe has become more strict and came out with new rules by the introduction of GDPR and the Copyright Directive. General Data Protection Regulation (GDPR) law was passed and it is considered to be the toughest privacy and security law in the world. It was drafted and passed by the European Union (EU), it imposes obligations onto organizations anywhere, so long as they target or collect data related to people in the EU. Also failure to comply can result up to penalties of up to 20M euro or 4% of annual global turnover to the company. Article 17 of the Directive says that platforms which allow users to upload digital content will be more liable than before if that material infringes copyright. Freedom of speech is seen as being at risk, as are intellectual discourse and the mutual exchange of ideas. Worst of all, at least from the E.U.’s perspective, is that this approach doesn’t really have any upside for European governments. That’s the thing with rule by regulation: without a focus on growth it is harder to create win-win situations. Indian model Indian market is quite unique because it is not restricting foreign companies when it comes to digital goods, leading to a huge number of users for U.S. companies like Google and Facebook. India imposes ranges from strong tariffs on electronics to a ban on foreign direct investment in things like e-commerce and has put restriction on foreign tech companies like banning of TikTok app.
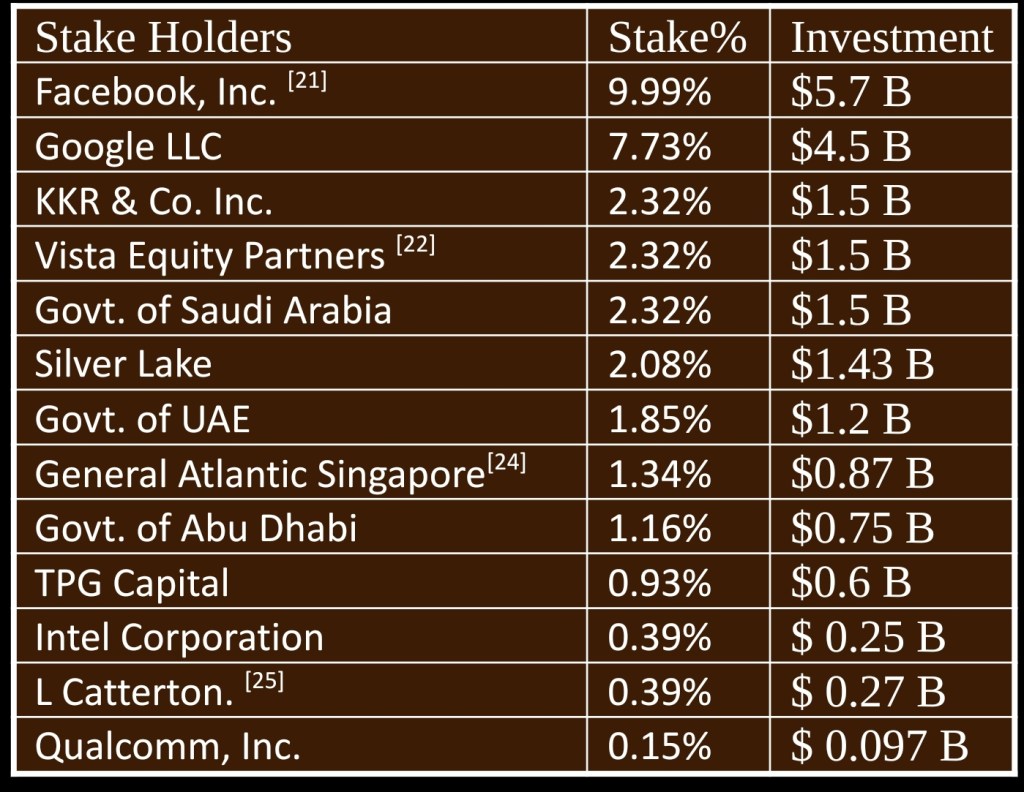
The Jio Bet India’s Reliance Jio Platforms is the world’s most ambitious tech company. Ambani launched the telecommunications business in 2016, spending USD 36 billion (Rs 2,49,759 crore) to roll out a 4G wireless network across India and luring millions of subscribers with free or cut-price data services. He’s now building on that business to create an online shopping platform, just as the U.S. giants come up against constraints on foreign e-commerce activity in India. The major players included Tata Telecom, Aircel, Airtel, Loop mobile, BPL, Videocon, R Com etc. By 2015 most of them went off market and there were only 3 major players left i.e Idea, Vodafone & BSNL. What made Facebook invest in JIO Zuckerberg said most of the Indian pollution resides in regions with low or no internet connection. But Jio made it all possible by establishing there bandwidth everywhere. And the free usage of unlimited data and calling had lured more user to use these service. Before Jio there were high prices for limited data for limited time but Jio offered for free for months and then started charging fees. This made Zuckerberg interesting in company to invest.
What gives Jio a chance are important differences from telecom efforts in other markets: Jio has created a huge portion of its addressable market; whereas a Verizon in the U.S., or a NTT DoCoMo in Japan was seeking to offer services on top of a competitive telecom market, Jio is the only option for a huge number of Indians (and for those that have options, Jio is so much cheaper because of its IP-based network that it can afford the extra costs). Jio brought the Internet to hundreds of millions of Indians that would never have had access, and the benefits of that investment are only going to increase as Jio’s services and partnerships come on line.
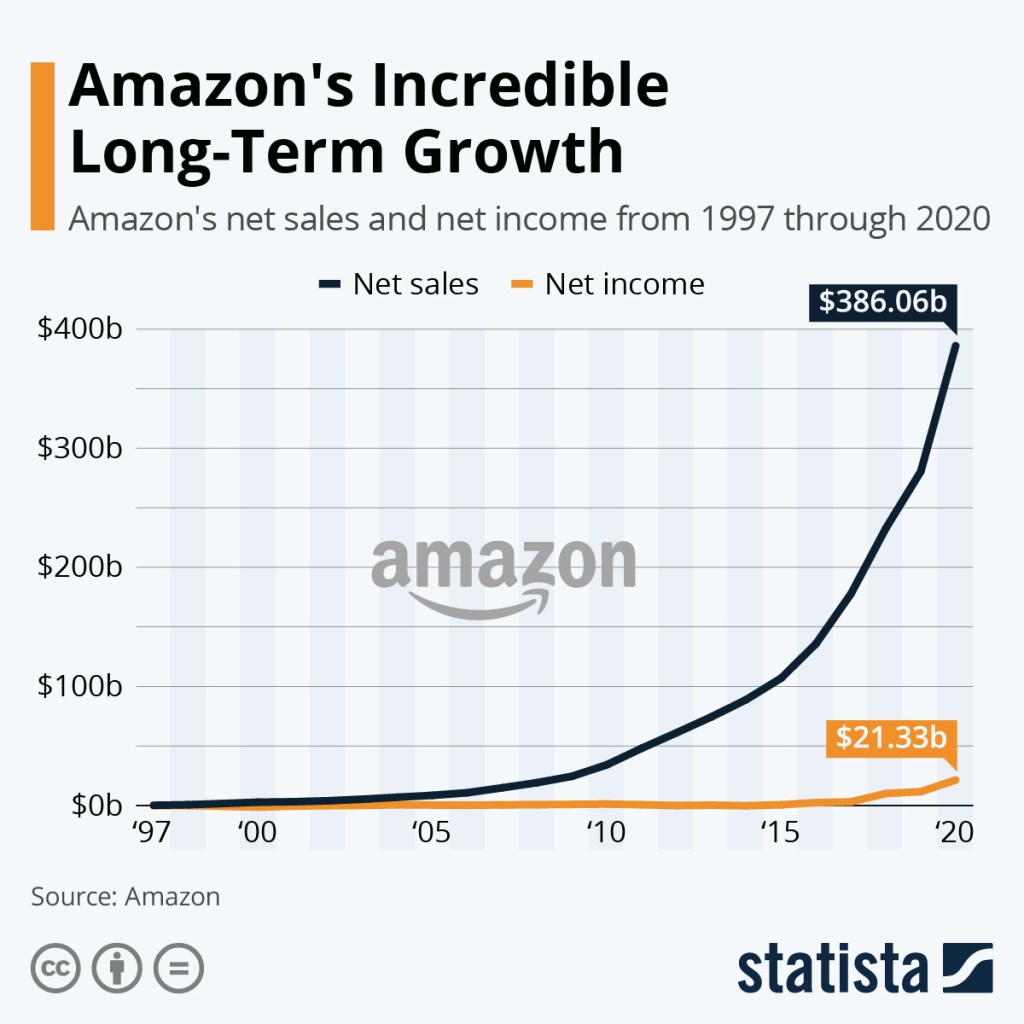
Amazon.com, Inc. is an American multinational technology company. It is one of the Big Five companies in the U.S. information technology industry, along with Google, Apple, Microsoft, and Facebook normally called as part of FAANG. But in the past 20 years Amazon has shown powerful Revenue but with just a minimal profits. It can be easily seen with Charts.
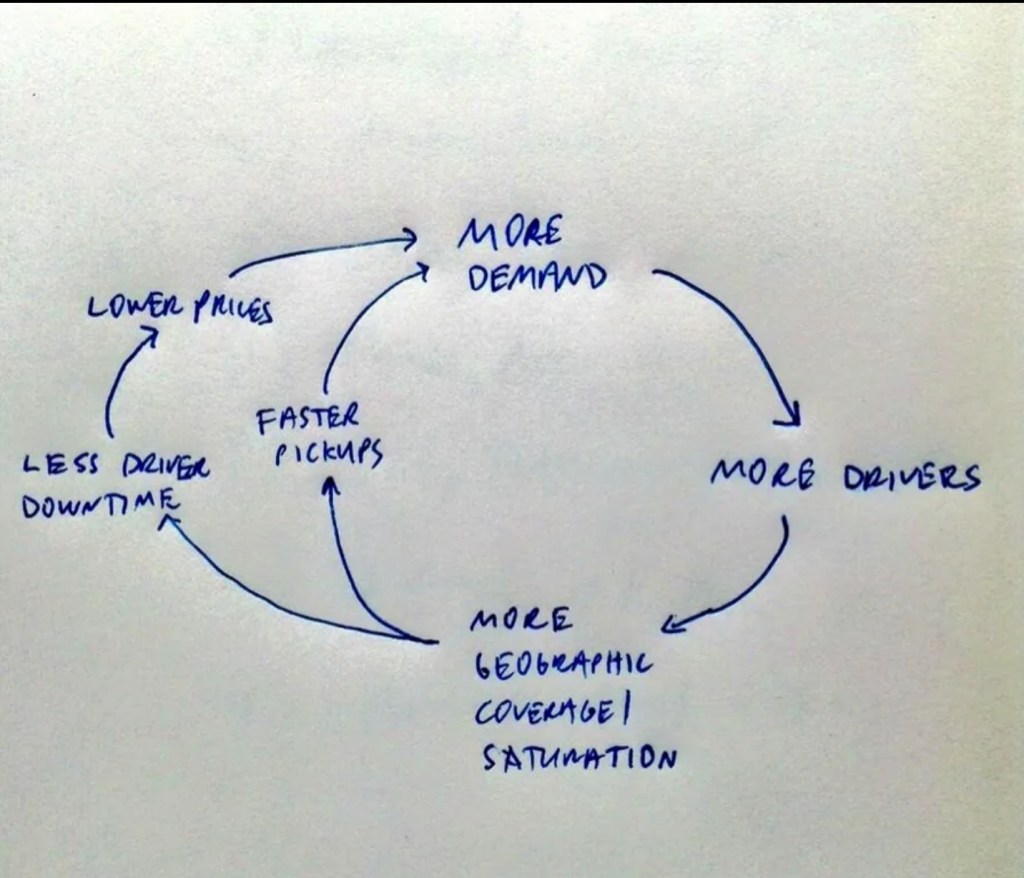
Does that mean it’s a failing business? No the small profits margins are one of the secrets for Amazon success. Amazon is intentionally showing low profit margins because large portions of profit is going in re-investment in the company to make it more profitable for future. But does that means everytime re-investments in our company can be profitable? No not everytime examples like Uber and WeWork tried to copy this strategy of amazon but they haven’t proved to be right. Amazon discloses revenue in three segments – Media, Electronics & General Merchandise Amazon divides its business into three segments: North America, International, and AWS. The first two of these segments, North America and International, refer to geographical breakdowns of Amazon’s retail business. They generate revenue from retail sales in North America and the rest of the world, as well as from subscriptions and export sales for those areas. Retail can further be broken down into online stores, comprising the bulk of sales, and physical stores. Media, Electronics & General Merchandise (‘EGM’) and ‘Other’, which is mostly AWS. Aside from retail, the other primary source of revenue for North America is subscriptions, including Amazon Prime, which offers unlimited free shipping, and unlimited streaming of movies, TV shows, and more. Amazon Web Services (AWS), launched in 2006, provides services to businesses, government agencies and academic institutions to store information and deliver content. Amazon says AWS provides an “infrastructure platform in the cloud,” for a variety of “solutions” such as hosting applications and websites, providing enterprise IT, and content delivery. Amazon controls about a third of the global cloud market. AWS’s biggest competitors are Microsoft Corp.’s (MSFT) Azure and Alphabet Inc.’s (GOOGL) Google Cloud. It seems pretty likely that these businesses, selling very different products bought with different bargaining positions to different people with different shipping costs, have different margin potential. This are not the only segments Amazon is in there are other business segment too. You can see revenue by broad categories of the business, but most of its costs are clubed together in one giant section on the income statement. It doesn’t present a full P&L by each business line to outside world so it becomes very hard to understand each business line individual. So, say, shoes in Germany, electronics in France or makeup in the USA are all different teams. Each of these businesses, incidentally, sets its own prices. And all the business segments are at different stages some at maturity some at growing some are not profitable. Books are a good example. There’s a widespread perception that Amazon sells books at a loss, but the average sales price actually seems to be very close to physical retailers. The gross margin has improved mainly due to the rising proportion of service sales (which include third-party sales) in overall sales, as these sales have lower cost of goods sold due as they are trading goods. However, this trend has negatively impacted costs as cost as a percent of sales is greater for third-party sales than Amazon’s owned-inventory retail sales. This is because, payment processing and costs are generally dependent on gross purchase price, but, the company recognizes only its share of revenue from products sold by third-parties as service sales. this means that the total value of goods that pass though Amazon with Amazon taking a percentage is perhaps double the revenue that Amazon actually reports.The revenue line is not really telling you what’s going on, and this is also one reason why gross margin is pretty misleading too. This means, in passing, that for close to half of the units sold on Amazon.com, Amazon does not set the price, it just takes a margin. The image below comes straight from Amazon – originally it was a napkin sketch by Jeff Bezos. Note that there’s no arrow pointing outwards labelled ‘take profits.’ This is a closed loop.
In any case, profits as reported in the net income line are a pretty bad way to try to understand a business like this – actual cash flow is better. As the saying goes, profit is opinion but cash is a fact, and Amazon itself talks about cash flow, not net income. And thanks to how Amazon’s payment cycle works, it usually gets money for selling an item long before it has to pay for that item. For example, it takes Walmart on average nearly three days to receive payment for goods after it paid its suppliers, while Amazon on average receives payment about 18 days before it paid its suppliers, according to the latest available cash conversion cycle data. It has even more money coming in before the money for last quarter’s bills is due and that’s the reason FCF are rising more than profits. Amazon focuses very much on free cash flow (FCF) and it has grown at 31.18% CAGR of 15 years From $529 in 2005 to $31,020 in 2020(data from http://www.macrotrends.net) . And from that majority part goes towards CAPEX and the remaining part is Operating cash flow. Amazon began spending far more on capex for every dollar that comes in the door, and there’s no sign of the rate of increase slowing down. Its free cash flow is higher than most of the revenue you’re seeing in many tech companies,” managing director at RBC Capital Markets Mark Mahaney told Recode. “You could take Snap, Twitter, and Pinterest and combine their revenue and that would be less than the free cash flow Amazon is generating.” Amazon has boundless ambition. It wants to eat global retail. If it were purely a software business, its cost of investment would be lower, but the amount of capital required to grow a business that has to ship millions of packages to customers all over the world quickly is something only a some of the companies in the world could even afford. The company’s strengths of integrated digital platforms in supply chain management and master till last line in delivery. Early this year, Amazon purchased eleven Boeing 767 passenger jets that are being converted to cargo planes, bringing its total fleet to 85 by the end of 2022; it is the first time Amazon is making an purchase as before it used to take on lease cargo planes. Between April and August 2020 , Amazon Air flights increased 27%. Amazon has been testing drone delivery and offers a program called Amazon Delivery Service Partners allowing people to start their own package delivery business using Amazon’s superior logistics knowledge and technology capabilities. By owning and controlling the major aspects of the supply chain, Amazon becomes less reliant on third-party suppliers like FedEx, UPS and USPS, allowing it to shorten its delivery time from click to door. In early 2020, Amazon reduced click to door time from 3.4 to 2.2 days (the industry average is 5.1 days). Amazon Prime’s has insanely-fast shipping. The most common guess as to how Amazon flips the switch is that it will wait until it is the last retailer standing and then raise prices across the board. Perhaps most important things is real cash profits not paper profits. Amazon’s access to cash enables it to do everything from paying its employees, suppliers, and shareholders to investing in its future. And while investing for its future lowers its profits in current years it also lowers its taxes by creating less taxable income. If you would have invested $100 in Amazon.com IPO in 1997 @ $18 per share you would have 5 shares. 2:1 split in 1998, 3:1 split in 1999 and again 2:1 split in end of 1999. Now the total number of shares would be 60. And the current market price in 2021 is $3,362 that means 60*$3362 = $210,720. And lets convert in INR , $1 in 1997 was worth ₹37 and now the current rate is ₹75 for $1. So the total investment would be ₹3,700 and the return would be ₹1.58 crores. Total return would be 427,035.1% return. Not all companies have an IPO that can guarantee you riches. Amazon has defied the odds and has arguably been the most successful public company in modern history.
Let’s begin with the most common distinction between these two terms. In general, we think of growth means adding new resources and revenue increases as result. Scaling means revenue increases without adding new resources. But the thing is profit in Growth increases with decreasing rate because the company revenue increases with new sales representative and it comes with salary so the net is effect is minimal. However in scaling revenue increases with a minimal cost and therefore the major change is seen in profits. And understanding the difference can mean the difference between more profit with less work, versus less profit with more work. A great example of a company that’s successfully figured out how to scale is Google, which in recent years has been adding customers (either paying business clients or ad-supported free users), while being able to keep costs at a minimum. As of 2017 it had seven products with over a billion active users each, while only employing about 88,000 people. Tie-up of Restaurants with food delivery partners increase more of revenue with just listing cost on their apps and leads to increase in profits. We can also understand Growth of business by Diminishing marginal Return If you keep increasing revenue by just adding more and more resources can lead to increase in cost also. And after a certain point your revenue will increase but at very decreasing rate and can even go to negative that growth isn’t a financial gain. Increasing the efficiency to make optimal use of existing asset to increase optimal revenue can lead to a large amount of profits. Scaling in Business Comes Naturally to SaaS Companies While all companies can potentially be good at growing, some companies are better positioned to scale than others. A software company are natural at scaling as they can reach more costumer and increase their revenue within a minimal or no cost Scaling in Saas companies comes with customer acquisition cost(CAC), Adding a new customer comes with minimal cost but it comes with acquisition cost. In saas companies acquisition cost are marginal cost. They often sell technical products to niche customer therefore to reach new potential buyers they need to spend on marketing to acquire new users. Higher customer lifetime value and higher CAC allows companies to scale them up. Each strategy should start with the uniqueness your business brings to the market. The strategy to differentiate your brand from the competitors cannot happen without strong internal process of your company.