PhonePe planning to enter Stockbroking business.

PhonePe plans to enter into competitive stockbroking business just waiting for its license by SEBI. And according to market participant there are more two fintech companies in line to enter into this business. Paytm was the first to get license from SEBI. PhonePe grabbed 44 percent of the Unified Payments Interface (UPI) market by facilitating 1.19 billion UPI transactions worth Rs 2.31 lakh crore in March 2021, compared to closest rival Google Pay’s 35 percent share and 957 million transactions. The size of the Indian financial services market could touch around $340 billion in the next few years.
PhonePe said it sold over 500,000 insurance policies on its platform during the period April – August 2020. PhonePe entered into the insurance segment in January 2020.

Overall, UPI had registered 2731.68 million transactions worth Rs 5,04,886 crore or Rs 5.04 trillion in March 2021. Paytm, the third distant player in UPI, has recorded 344.99 million transactions worth Rs 38 thousand crore in the last month. PhonePe got this big due due to the massive adoption it is seeing in Tier-4,5,6 towns and talukas and a deep focus on driving merchant acceptance in these geographies. PhonePe is today accepted across 18 million kiranas in the country. PhonePe has to comply with new rules of National Payment Corporation of India for starting stock broking business. This fintech company has raised $700 million from Walmart in December 2020. They expect there is still growth in retail investment market. The main thing is the flat fee at which the trade takes place. Paytm flat fee is Rs 10 and while other brokers charges RS 20-25. The cheaper plans have attracted more investors.

Digital Asset? Cryptos leaves wealthy Indians in Catch-22 situation.

The world of virtual currency is vast and ever-growing, and Bitcoin is amongst the supergiant’s of the industry. There has been GREED over PANIC because bitcoin has surge by 950% in a year unimaginable gains to investors. Unocoin, one of India’s oldest exchanges, added 20,000 users in January and February, despite worries of a ban.
Reserve Bank of India’s liberalised remittance scheme (LRS) which permits a resident to take a position as much as $250,000 a year overseas in shares, bonds and properties amongst different issues has led to investors purchase bitcoin in overseas account. And they are also buying by using Debit & Credit cards. These digital currencies are not shown in their holdings and are kept away from Taxman. But when they share this information the legality of this transaction may be questioned. These can be treated as intellectual property or software as said by RBI. And the import of intangible asset is permitted. But the disclosure of these currencies are creating dilemma over investors. Because any foreign account or any asset hold by an Indian Residents outside India need to disclose. But an investor should be aware when government can penalize or ban private cryptocurrencies. Certain time period was given to investor to liquidate theirs cryptocurrencies in the past verdict of court.
But now apex court has observed that cryptocurrencies are unregulated but no illegal this has made the traders relived. And the Central Government is planning to introduce its own cryptocurrency in India CBDC (Central Bank Digital Currencies).

Key takeaways from the book coffee can investing Part 2

How Patience and Quality Intertwine
Over the past 41 years BSE SENSEX has give CAGR of 16.37% with base value of 100 in the year 1979 and now at 50136.58 in the year 2021. This return is more than higher of CPI and Risk Free Rate.
So why does an Investor lose money in Equity markets?
They are loss aversion, investor dislikes losses of 2-2.5% than gains. The probability of generating positive returns increases with the holding period for BSE Sensex. Investors who do not have even a year of patience are likely to believe that Equity markets have higher risk than return. Short term investors frequently update or rebalance their portfolio are more likely to suffer losses than gains.
Patience premium is the difference between return of a stock and index over holding period. A positive value of ‘patience premium’ implies that the longer the holding period of a stock, the higher is the return generated from it for an investor. As the holding period increases, the risk i.e Standard Deviation decreases. The one-year investment horizon has the widest range of equity returns, from a peak of 256 per cent delivered over April 1991 to April 1992 to a trough of -56 per cent delivered over December 2007 to December 2008. The one-year investment horizon can be an intense roller-coaster ride. The degree of risk involved in a one-year holding period has been 3-4x higher than the risk involved in a five-year holding period and 6x higher than the risk involved in a ten-year holding period.

If one would have just invested RS.25k at initiation in BSE SENSEX and have not done any changes would be worth of RS.12.5 millions after 41 years with CAGR of 16.37%. This how the patience premium is earned.

Quality premium is the difference between the annualized returns generated by a stock or a portfolio of stocks and the benchmark index over holding period. If the premium if positive it means your selected stock or a portfolio has outperformed the market with same investment.

Observation are seen in CCP since 2000 are very interesting:
Observation No. 1: The shorter the holding period, the higher the quality premium but by only upgrading/holding their portfolios of quality companies. because in short horizon quality is not that important to generate good returns but it comes with greater volatility.
Observation No. 2: A high-quality portfolio with a very long holding period delivers the highest return with the lowest risk. Because here the quality of business is the most important factor. And longer the holding period higher the compounding rate and higher the return and lowers the risk associated with it.
It has been observed that quality company with patiently holding over the years and tracking the company can beat the returns of INDEX with less volatility.

Pulling It All Together
Essentially, what this book has highlighted is that: Investing for long periods of time in high-quality portfolios with a higher weightage to high-quality small-cap companies while ensuring that you don’t pay too much by way of fees and avoiding investment traps like real estate and gold should lead to significant and sustainable wealth creation.
If one is investing in financial assets it should be backed by some goals. Goals like financial stability, Ambition and for the security for other family members. All of these carry a financial cost and the cost rises with the inflation so you need to make sure returns are compounding more than inflation to create a healthy wealth. And if the goals are way to much expensive then you need to adjust your priority.
Warren Buffett’s famous two rules on investing are:
Rule No. 1 – Never lose money.
Rule No. 2 – Don’t forget rule number 1.
Good & Clean framework:
Good stocks are those that have created shareholders values. The goodness factor can be measured by a company doing multiple things as the following
Invest capital,
1)Turn investment into sales,
2)Turn sales into profit,
3)Turn profit into balance sheet strength,
4)Turn all of that into free cash flow,
5)Invest free cash flows again.
Clean stocks are the stocks that have a good corporate governance & all the necessary proper disclosures. The good helps generate the upside while not compromising on clean reduces the downside risk

You need more upside to make up for the downside.
RS 1000 invested in all cases.

If your investment are 10% down so now your current value of your investment is now RS 900. To again reach to your initial investment you will invest RS 900 and 11% is required rate of return.
Lets do math,
PV= -1000 , I/Y = -10% , N=1, FV= 900. Now you are investing 900 so PV= -900 , FV= 1000 , N=1 , I/Y will come to 11%.

A highly credible debt fund is main factor while choosing right debt fund because as the credit quality is high the YTM is low for that fund. In Debt the safety of capital should not be compromised for a few basis points of extra returns. A debt mutual fund’s return is a function of: 1. Yield to Maturity (YTM), 2. Mark to Market (MTM), 3. Expense Ratio. In its most simplistic form, Debt Mutual Fund’s Return = YTM + MTM – Expenses.

The power of Equity
It was a mistake of Mr. Talwar for not investing in equity and holding it for long term. It can be described by a chart

Mr. Yogesh Talwar’s Case
He is an MBA & And has strong academic results. He was earning 2 lakh rupees per annum. he was had also invested in stock market is random stocks based on friends advice and selling it when price went up little bit. In those days stock market was just trading no concept of long term holding. And majority weight in Mr. Talwar portfolio was given to real estate. He had bought new luxury home in Noida and things went off the road in market crash of 2008. The random stocks which were bought by him were in deep negative returns and after that there was recession in real-estate too which wiped of his portfolio.
Then after that Mr. Talwar met Nikhil a financial advisor. He asked Mr. Talwar to write his investment. Then Nikhil calculated his net worth and he had earned just 4% over the last 27 years. Then he asked Mr. Talwar to write his financial needs and goals. The future expense were far way from his current return on investments. He approximately needed 21% return on his capital on post-tax basis. After all the discussion Nikhil made a new portfolio idea for him to try to achieve his goals.

Mr. Mukesh Sanghvi case
He was a joint owner with his brother & sister in textile business.
Mukesh Sanghvi was clear that at fifty-five years of age, he wanted to take it easy and live off his accumulated wealth. It was by no means meagre— according to a rough estimate he had Rs 25 crore spread across assets like residential and commercial properties, gold, FDs, stocks and a significant amount of cash he would receive from the liquidation. The annual expense of his family was 1.5-2 crore and he was a risk seeker in stock market. He was dealing in Future & Options. At the peak of 2008 he had about 150 crore worth of holdings and after the crash he was worth 25 crore. He was also giving loan in Hundi circuit at 25% per annum. Later after that Mr. Nikhil a financial adviser also came into his life and made him understand a good portfolio and their healthy returns. He had drawn down all the financial needs and goals of Mr. Sanghvi and his net-worth was around 451 crores. As the goals and expenses were too high Nikhil advised him to put more allocation in Equity to try to achieve those returns. Because Mr. Sanghvi is fully dependent on his portfolio to meet his expenses.
Breakup of his portfolio was 15% debt and 85% Equity in dividend paying stocks. And Debt investment in liquid funds to meet emergency needs.

How Punchy Can the P/E Multiple of a Great Company Be?
A large portion of investor’s uses P/E multiples for valuation. Most of them say buy at low P/E and sell at high P/E. The interesting thing about earnings is that it can be manipulated by management , and it does not provide re-investment of their earnings.
Lets take an example, Company X and Company Y has same earnings growth and same Revenue growth of 5%. Company X has P/E of 5 and PEG of 1 and Company Y has P/E of 7.5 and PEG of 1.5 . A normal investor would buy the company X and short the company Y based on P/E multiples. But the main thing is Company X needs to reinvest 50k to get 5% growth while Company Y need to re-invest just 25k to get the same growth. We can also state that marginal return on capital of Company Y has 20% while Company X has 10%. Higher P/E can also be justified by high earning growth in coming future.

Mean Reversion, this theory states that when there is no growth in a particular stock its P/E start to decline to Average Index P/E. So if a company is sustaining its ROCE to be at 35% and re-investment rate of its earnings to be 50% the P/E multiple will be higher due to higher growth and will fall to Index P/E when there is no growth left.
Lets say if a company is growth at 17.5% and the SENSEX CAGR is 13% for 25 years
Total return for shareholder after 25 years would be 25*(1.175)25 = 1408.92.
Discounting this return with opportunity cost of capital = 1408.92 / (1.13)25 = 66.36.
This company’s P/E would be trading at approx 66.
And majority of good business are trading at high P/E and outperforming the market. So it means healthy returns can be earned while entering with P/E.
Should Investors Sell Coffee Can Stocks When Markets Are Richly Valued?
CCP enjoys it competitive advantage over its competitors. Buying the CCP when Nifty P/E < 14x and selling when Nifty P/E > 20x has not outperformed ‘buy and hold’ strategy. So trying to time the market using this multiples has always been proved wrong as the good business have strong fundamental and always looks expensive.
How Coffee Can Portfolios Outperform during Market Stress?
Only when the tide goes out do you discover who’s been swimming naked. This quote of Warren Buffet has always been proved correct. When there is market crash majority of the companies erode the value to investor because they have not understood the company fundamental and its risk. And all the great business with sound fundamental stays positive.
When the market falls CCP tends to fall, but when market starts to show recovery CCP start to show recovery two times faster than market.
All the key learnings from this is that one should invest in a quality company he understands thorough research is necessary and apart from that one should clear all the noise and buy & hold long term and track the price and let the compounding magic show its effect on your wealth. And if investors does not understand a business or company he should passively invest in INDEX funds or Coffee can Portfolio to grow their wealth.

Key takeaways from the book coffee can investing Part 1

About the Authors:
Saurabh Mukherjea
is the Founder and Chief Investment Officer of Marcellus Investment Managers. Marcellus Investment Managers was incorporated in August 2018 and the firm’s application to conduct Portfolio Management Services was approved by SEBI in October 2018 and provides portfolio management service.
Rakshit Ranjan, CFA
Rakshit has a B.Tech from IIT (Delhi) and is a CFA charter holder. He launched Ambit’s Coffee Can PMS in Mar’17 and managed it till Dec’18. Under his management, Ambit’s Coffee Can PMS was one of India’s top performing equity products during 2018.
Pranab Uniyal
is the head (products and advisory) at Ambit Capital. He has a BTech degree in chemical engineering from IIT, Madras, and a postgraduate diploma in management from IIM, Calcutta.

The culture of Stock Market in India:
Millions of young Indians have started stock trading during the pandemic, raising hopes that the appetite for equities in the world’s second-most-populated nation is finally growing. Historically gold has given low returns, I do not think modern Indians are investing much in gold and real estate with sums upto to 88%. Things have changed over the last years. Moreover, after demonetisation and better tax administration, widespread diversion of black money to gold and real estate has come down significantly. All the brokerage house have seen tremendous growth in opening new Demat account. But after that also only 5% of Indian population invest in financial instruments. For India’s 1.36 billion people, only about 3.7 per cent invest in equities, compared with about 12.7 per cent in China, according to stock depository data on the number of investment accounts In the US about 55 per cent of the population owns stocks either individually or through a mutual fund.

Common mistakes investor does that leads to wealth erosion:
Not having specific plan/objective to invest lacks to specify the duration of investment.
Trading too much to make small gains that leads to short term capital gain tax and brokerage is also high in these activities.
Risk averse invest in FDs and Risk seeker invest more in risky assets that lacks diversification.
Timing the market is the wrong activity one does. Investor think they can catch the stock at low and sell at high.
The effect of Inflation should be adjusted in the potential gain in any investment.
Coffee Can Investing:
Churning your portfolio, i.e., buying and then selling stocks frequently is one of the easiest ways to produce sub-optimal returns in the stock market. Appreciating the destructive power of churn, most thoughtful investors have tried different ways to reduce churn and thus hold stocks for much longer periods of time. regard has been the “Coffee Can Portfolio” construct created by Rob Kirby of Capital.
There are various misconception in investing like more return has to come with more risk. But not in all the asset class for example in equity selecting a efficient company after analysis and understanding various risk related to it and then investing and holding it for years comes with greater return than risk. Another misconception is that “buy and forget” this strategy works in a rare case the perfect statement would be “buy and hold” and track where the price of that stock is going.
It was interesting to know that Sir Issac newton the great mathematician and breaking all the new discoveries could not understand the market. Being smart does not mean smart investor. And being patient is a quality required in investing.
Coffee can portfolio focus on strong characteristics:
Revenue earned from core business not from other source of income. And y-o-y growth rate.
Top players in their respective industries. Basically a moat
Trustworthy management and their sensible asset allocation strategies.
Company that has both tangible and intangible asset. Because company with tangible asset can be copied not with intangible asset. Intangible asset makes the company different from others.
Focus on Company which has lower Debt as compare to Equity.
In Berkshire Hathaway’s 2007 letter to shareholders, Warren Buffett explains that the kind of companies he likes to invest in are ‘companies that have
a) a business we understand
b) favorable long-term economics
c) able and trustworthy management
d) a sensible price tag. A truly great business must have an enduring “moat” that protects excellent returns on invested capital.
Composite of Coffee can portfolio
Coffee Can Investing is an old concept of the West. Where people put valuable possessions in a coffee can and hide them. After many years when they open it, they usually end up with huge profits. Coffee Can investing style can be replicated by buying the best company with a good track record & holding them for years. There are various filters use to identify quality stocks.
Below are the 3 main points required to be satisfied before investing:
Segregate companies into Small Cap (Market Cap of 100 Crores- 5000 Crores), Mid-Cap (5000 Crores- 20000 Crores) & Large-Cap (20000 Crores & above).
Sales should have grown by 10% in the last decade on an average basis. (Growth prospects)
ROCE of 15% should also be generated. (Returns to lenders of capital). Adding a risk free rate to Equity risk premium along with credit rating sums up to 15%
ROE of 15% as it shows the ability to generate higher profits for shareholders. on a given capital base.
Loan growth of 15% as the GDP of India on average for past 10 years is 13.8% so loan growth of 15% shows banks creditability
Why use a ROCE filter of 15 per cent? We use 15 per cent as a minimum because we believe that is the minimum return required to beat the cost of capital. Adding the risk-free rate (8 per cent in India) to the equity risk premium of 6.5 to 7 per cent gives a cost of capital broadly in that range. The equity risk premium, in turn, is calculated as 4 per cent (the long-term US equity risk premium) plus 2.5 per cent to account for India’s credit rating (BBB-as per S&P).
Why use a revenue growth filter of 10 per cent every year? India’s nominal GDP growth rate has averaged 13.8 per cent over the past ten years. Nominal GDP growth is different from real GDP growth. Nominal GDP growth is not adjusted for inflation. In simple terms, it is (GDP) evaluated at current market prices. A credible firm operating in India should, therefore, be able to deliver sales growth of at least that much every year.
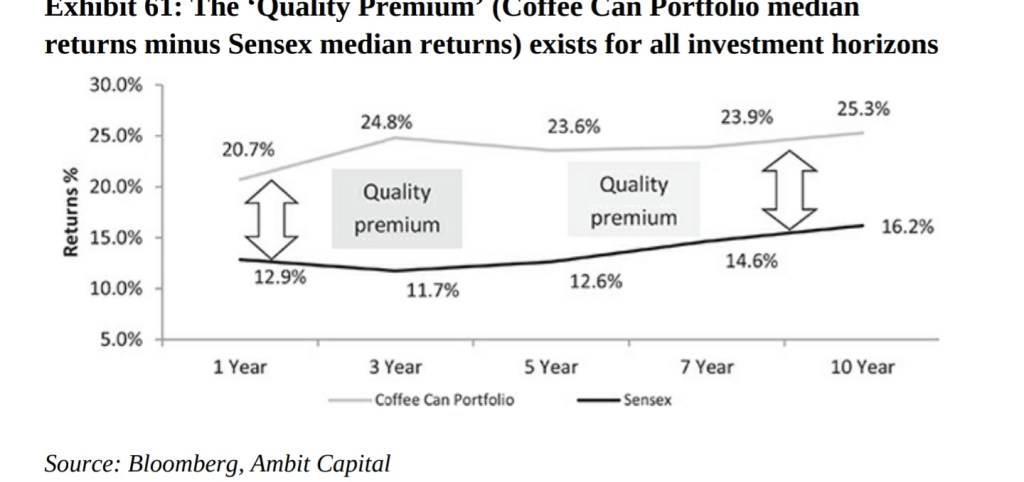
The importance of Coffee Can Portfolio.
Having a quality portfolio is extremely necessary to create a healthy wealth . The following two points have been observed when the markets fall.
CCPs tend to fall less when the markets fall.
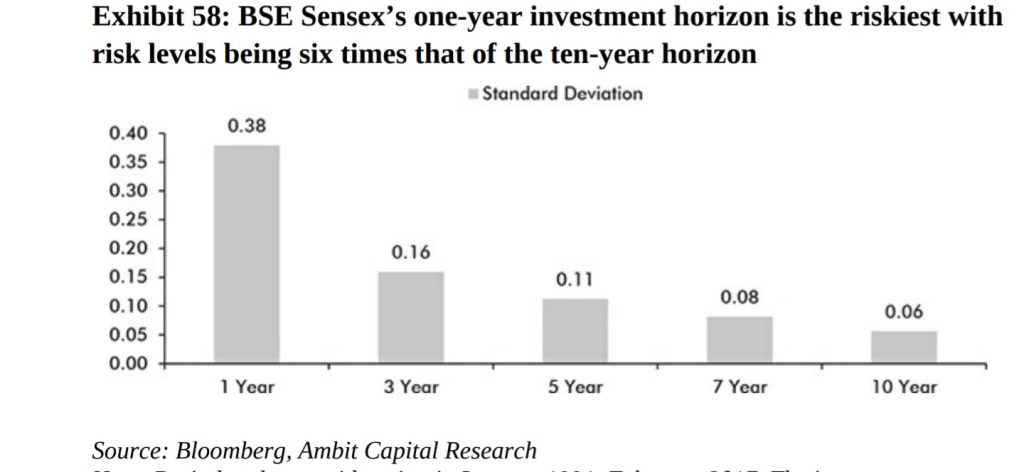
The recovery is quick & stronger when the markets start rising again. In simple terms, it means that historical data suggests the Coffee Can Portfolio offers more than a 95 per cent probability of generating a positive return as long as investors hold the portfolio for at least three years. If held for at least five years, there is more than 95 per cent probability of generating a return greater than 9 per cent.
Advantages of Coffee Can portfolio
Investors do not need to track their portfolio once the initial hard work is done.
It minimalizes the expense cost. We do not need to pay the costs like management fees, transaction fees, the opportunity cost of tracking the portfolio, etc.
The volatility is ignored as you do not need to track the portfolio.
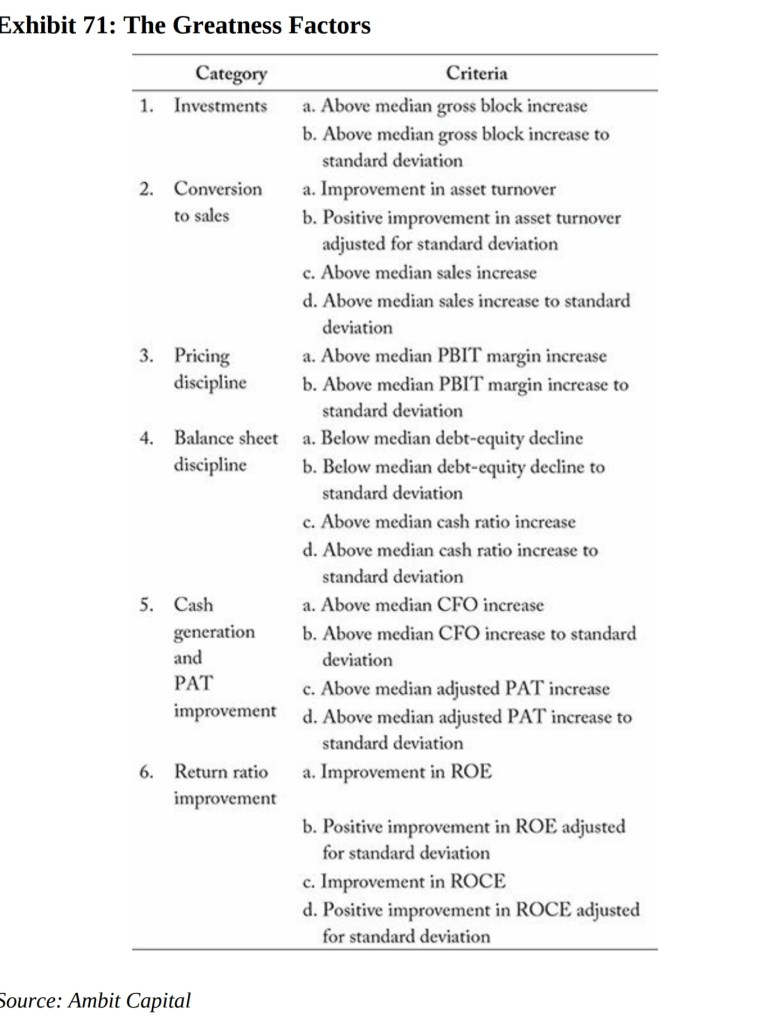
Why choose revenue growth and ROCE as the financial metrics to measure ‘greatness’?
Charlie Munger, vice chairman of Berkshire Hathaway, stated in his lecture at the University of Southern California in 1994, ‘Over the long term, it’s hard for a stock to earn a much better return than the business which underlies it earns.’ Munger meant that the returns generated by any company’s share price in the long term cannot be significantly more than the return on capital employed generated by the company in its day-to-day business.
He explained this with an example, ‘If the business earns 6 per cent on capital over forty years and you hold it for those forty years, you’re not going to make much different than a six percent return—even if you originally buy it at a huge discount. Conversely, if a business earns 18 per cent on capital over twenty or thirty years, even if you pay an expensive looking price, you’ll end up with one hell of a result.’
Three categories of businesses based on Return on Capital:
High earnings businesses with low capital requirements: For example Candy store, these businesses can’t, for any extended period, reinvest a large portion of their earnings internally at high rates of return. Candies business can grow with incremental income. Two drivers for minimizing capital requirement first is that business is a cash business and second is the difference between production distribution process is minimal so no need of holding inventory.

Businesses that require capital to grow and generate decent ROCE: A fast growing business needs huge amount of capital to grow. Capital requirement in fixed asset and some tied in working capital to increase revenues. Such business provides decent ROCE.

Businesses that require capital but generate low Returns on Capital: This type of business is Telecom sector which require huge amount of capital to grow. In this business sector customer base is more important where CFI is more than CFO.

Page Industries: A case study of ‘greatness’
Page Industries Ltd. is engaged in the manufacturing distribution and marketing of Innerwear Athleisure Sleepwear and Swimwear for men women and kids. The company is the exclusive licensee of Jockey International Inc. (USA) for manufacture distribution and marketing of the JOCKEY brand in India Sri Lanka Bangladesh Nepal UAE Oman and Qatar. Page Industries is also the exclusive licensee of Speedo International Ltd. for the manufacture marketing and distribution of the Speedo brand in India consisting of swimwear apparel water shorts equipment’s and footwear. JOCKEY is the company’s flagship brand and a market leader in the innerwear category. The company has established the premium segment in the innerwear category in India through brand Jockey.

As per Warren Buffett’s categorization of businesses, Page Industries is a
perfect example of a business that requires capital to grow and generates
decent ROCE. Over the past ten years, Page has, on an average, reinvested around 50 per cent of its operating cash flows back into the core business via fixed asset investments to expand its manufacturing capacity. Despite this, the firm has either maintained or improved its ROCE over time, implying that it has successfully and consistently generated healthy ROCE on the reinvested capital as well.

How did the Page Industry sustained over the years in just one business segment? With various competitors in various segments. One would think making and selling innerwear isn’t a big thing. A innerwear should always be more comfortable than clothes we wear over. Jockey has provided best quality of comfort over the years and still maintains it. Innerwear also has to be strong and durable. As if all this wasn’t enough, difference in physiques, weather-related factors and consumer preferences of comfort in India are not entirely similar to those abroad. Consequently, the product design, fit and fabric composition of an undergarment stock keeping unit (SKU) has to be indigenized in order to be successful in India. If a consumer accepts a particular style and brand, it is highly likely that she/he will stick to it. Therefore, consistency of product quality and design.
The ‘feel good’ factor of consumer purchase in innerwear is driven by a combination of fresh introduction of designs across sub-segments of innerwear and fresh introduction of colours within existing styles. Very few clothing brands have got all these factors right in India. The firm has been very focused on deepening its moats for a very long time. Genomal family (the promoters of Page) have focused on the undergarment business and have no intention of diverting to anything else.
Page has maintained
a) measured capacity expansion with no more than 1500 labourers in a single factory, which reduces the risk of unionization;
b) focus on hiring women
c) lifestyle support provided to the workforce. This workforce is regularly
trained to ensure high efficiency levels. These aspects have been supported by use of operational efficiencies and R&D to help it produce a high-quality product.
Between March 2007-2017 this stock has given CAGR of 45%.

What about Valuation?

The started period valuations has little or no impact in long run. Some might say that buying cheap stocks is not a very clever idea. But surely, selling expensive stocks when they become expensive is a good idea.’

Coffee can investing is more oriented towards:
More B2C (Business to Consumer) than B2B (Business to Business)
sectors.
More structural rather than cyclical plays.
Avoiding companies that borrow lots of money to grow.
Prefer companies with intangible strategic assets.

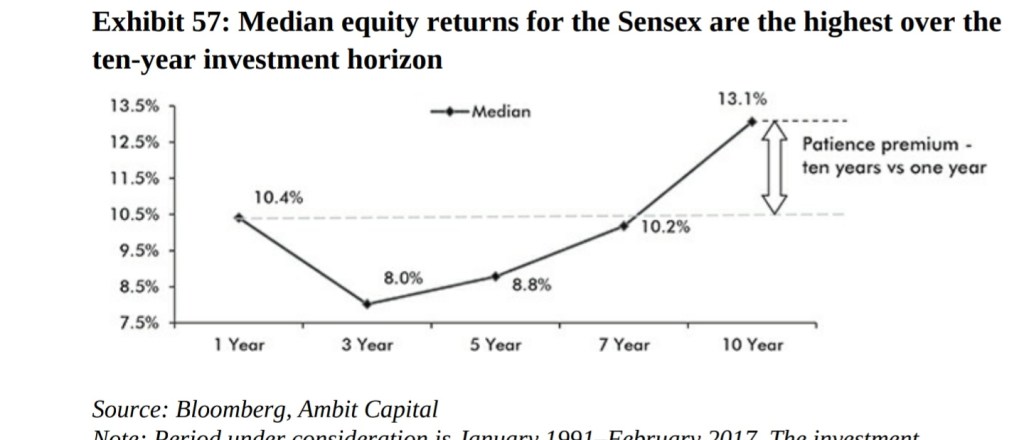
Power of compounding: Holding a portfolio of stock for ten years or more allows the power of compounding to play out its magic. Because the effect of compounding is not seen in early stage of investing it is seen in later stage of your investment horizon that should be minimum of 10 years.
Complex Investments (ULIPs).
ULIPs (Unit Linked Insurance Plans) are hybrid instruments having a dual purpose of insuring towards life cover & invest the remaining money in financial instruments. The financial advisors lure more investor into this because they get more commission. The true picture of this plan.
Most of the investors have no clue about the terms of these Plans.
The premiums paid by the customers go heavily towards brokerage commissions (40-60% of the first-year premium).
Most of the investors were not informed that they were required to invest every year to avoid lapsing of their policies. The terms were so strict that even a single lapse by investor gave companies the right to confiscate the customer’s fund. This led to a loss of 1.5 lakh crores for the retail investors falling for these products.
Index Funds v/s ETFs And Active Managed Funds
Both are passively managed investment vehicles designed to mimic the performance of other assets class but ETFs are actively managed investment in small percentage. Index funds have more expense ratio than ETFs. ETFs, or exchange traded funds, which fully replicate a benchmark. For example, a Nifty ETF is a fund that invests in all the fifty Nifty companies in the same proportion as they are in the index. This ensures that the value of the fund moves exactly like Nifty. In an actively managed fund, a fund manager manages the money using his judgement and discretion and thus charges a fee for using his brains. At the other end, passively managed funds have no input from a human manager

Many Expenses investor pays knowingly or unknowingly,
Transaction Fee is also called a brokerage fee. For example your broker charges 0.5% on buying and selling that means if you buy and sell for 5 times your total transaction fee is 5% of your portfolio return.
Annual Fee is also called as AUM asset under management charged by various PMS Additionally, there may be a performance fee as well where the fund manager is entitled to a share of the profit that he is able to generate for investors.

Hidden Fee this type of fee is not easily understood by many investors such as hidden fee in ULIPs.
Fund Expenses compound too: The investor pays certain expenses for this fund management (Mutual Funds/PMS)t as well as other operational expenses. Lets compare two funds. Fund A has 2.5% charges and B has 0.1% charges and both have same Gross return of 15%. 1 Lakh Invested in each fund for 40 years. Fund B has reached Rs 2.6 crore and Fund A is at Rs 1.1 crore. The difference is compounding of expenses which is lost by Fund A. Most Mutual funds have expense ratio of 2.5% and ETFs have 0.1%. Most investor focus on gross return and not the expenses.
American investor have started taking out their money from active funds and have parked their money in passive funds. The 80% in passive and 20% is active is changed from 20% in passive and 80% in active funds.
Entry of SEBI, direct scheme were launched by SEBI in 2007. Direct scheme involves just the investor and fund manager. So there are no intermediary so no brokerage cost or any other cost just the minimal percentage to be paid to fund house. Fees in direct funds are half than Regular fund. In 2013 SEBI made it compulsory for all the mutual funds to have direct option for investors. In response, SEBI, through AMFI the mutual fund industry’s trade body introduced the ‘best practice guidelines’ in 2015. The guidelines stated that the upfront commission that a fund pays to a distributor cannot be more than 1 per cent.
A twenty-year-old who invests Rs 1 lakh at the start of his career will get Rs 1.6 crore at the age of sixty from his investment in the direct fund (which has no involvement with any distributor). In contrast, he will only get Rs 1.1 crore in the regular scheme. As much as Rs 50 lakh, or a staggering 31 per cent of his returns, are taken away by the distributor from whom he bought the fund forty years ago.(assuming direct funds charges 0.1% and regular plan charges 2.5%)
Finally, SEBI has created a new regulatory rule which forces intermediaries to declare whether they are a fund distributor, or an ‘adviser’ whose fees will be paid by the ultimate investor and whose interests are fully aligned with the investor. The combination of hiring a good adviser and then purchasing sensibly priced funds directly from the fund houses gives investors a higher chance of generating healthy returns while keeping risk under control.

How Indians fell in and out of love with stocks:
It was between 1990 and 1995 that retail investors in India fell in love with stock market investing for the first time. In this period BSE Sensex was quadrupling in less than twenty months—from 1000 points in July 1990 it crossed 4000 points1 in March 1992, supported by the liberalization of economic policies. Investors’ love for the stock market was such that the number of retail investment folios that existed in 1995 was more than the number today. The effect of this investor interest was also reflected in IPOs—during 1992– 96, around 4000 companies went public (implying around four IPOs per day). All the investors were investing their black money because lack of regularity. In that period company used to give 6-8 pages of IPO prospectus to investor versus 500 pages of today. Many promoter defaulted many companies came out be a dump company but after the SEBI came into picture and changed the format of holding stocks in Dematerialized form. After that phase people started investing in Real estate and gold in the year 2013. There was a boom market for real estate prices in Mumbai were same as New York city. However, there has been a trend reversal in investors’ choice of asset classes since 2015, the year in which the NDA launched its multi-pronged attack on black money.
The NDA’s success in dramatically reducing the flow of black money seems to have been centred around:
Directly transfer of subsidy and benefit from Indian Government to Beneficiary. Government disburse 4% of GDP or 6 Lakh crore to beneficiary account. This new policy were implemented by our Prime minister of India Narendra Modi. In past years half of the subsidy were stolen by politicians.
Demonetization: On 8 November 2016, the government demonetized 86% of the country’s total currency in circulation. This resulted in the forced deposit of over Rs 15 lakh crore (US$ 230bn or 10 per cent of the GDP) into the banking system, of which a sizeable proportion is likely to have been black money.
The Real Estate Regulatory Act (RERA): Over the years builders used to trade in black money by cheating government in stamp duty and registration. There was no transparency and accountability of funds. Without the permission rules they used to Start building on plots with bribing the government. RERA act came into effect by 1st May 2017 it has led transparency and sound business. From now on 70% of the funds collected from buyers are kept in separate bank account to meet the building material cost this has stopped diverting the funds into another type of land acquisitions.
Introduction of GST: The introduction of GST came in 2017 those who are not paying taxes find it difficult to get new customers. Those who are not paying taxes are not getting benefit of Input tax credits which helps in reducing tax burdens.
Small cap companies has outperformed large cap stocks. The outperformance over large cap was 5.9% between 1998-2004 while in US it has been 4.6%. BSE Small-cap includes 768 stocks with a median market cap of Rs 1600 crore.) Over the past eight years (2009 to 2017), the BSE small-cap index has beaten the BSE 100 by 4.6 per cent per annum.
Why great small cap companies has outperformed the large cap?
Small cap grow faster when the liquidity is more in market so small company can easily get loans from banks while having low creditability. Another reason can be when large cap companies are going through disruption there is where competitive advantage lies. The probability if a great company becoming sector laggard is 25% while staying again at the top for the next decade is just 15%. On the other hand, owners and managers of small companies are hungry to grow, hungry to achieve greatness and all the perks which come with it. This helps smaller companies consistently grow profits faster than larger companies.
Most of the brokerage house ignores small cap and does not publish any reports and this small cap stocks are not in media coverage. Small cap stocks are more riskier than large cap stocks. Small cap stocks lacks in managerial staff as most of the small cap promoter holders and their company director are family members only.

Portfolio managers have a problem with the approach as they need to perform better month-on-month & year-on-year. This restricts them to implement buy & hold strategy & save transactional costs. Approaching investing in coffee can be very difficult for them as they have to put in a lot of effort in the start and ripping benefits would take years. Also, convincing investors to stay invested for 10 years itself is a difficult task.

The Four Stages of Disruption

by Steven Sinofsky

If we’re so aware of disruption then why do great product or business keep getting disrupted?
Disruption is described as a disturbance or problem that interrupts an event, activity or process. However, the disruption could also be problem-solving process.
Four stages of Disruption
1)Disruption of Incumbent:
When a new product, service or technology becomes available, a moment of disruption occurs. Incumbent’s attitudes towards technology disruption should range from New technologies are inferior. New products do not do all the things existing products do, or are inefficient. New services fail to address existing needs as well as what is already in place
2)Rapid Linear Evolution:
The product creators are still disruptors, innovating along the trajectory they set for themselves, with a strong focus on early-adopter customers, themselves disruptors. The disruptors are following their vision and continue to innovate. The incumbents continue to compare the products along their existing and successful path.
3)Appealing Convergence
The market begins to call for the replacement of the incumbent technology with the new technology of disruptors. In this phase, the entire market begins to adopt capabilities of the new product. Whereas the customer base of the incumbents start upside down as they are not battling with new changes coming up in market.
4)Complete Reimagination
Technology disruption is when a category or technology is reimagined from the ground up. The disruption has reached a point when companies have no choice but to accept reality, the industry has fundamentally changed. For incumbents they find themselves poorly positioned to take a strong market position.
There are many examples of this path to disruption in technology businesses,
People are using more of smart phone cameras instead of professional camera like Kodak, Nikon they were the leaders at their time.
Netflix is disruptive for cinema theatres and for Television channel. It has a low cost strategy and subscription based model.
Music apps like itunes and spotify are much cheaper and handy as compared to mp3, Ipods.
Being incumbent, one should look what is happening in today new world and try to innovate their products or services at most superior so that the changes in new world cannot create a hinderance in your path.
Being disruptor, the new changes or innovation made in new product gets more attracted towards customers. So now you become incumbent and another business try to take your competition. For everyone, timing is everything when to enter the market.
Actions of many parties create unique circumstances each and every time. There is no guarantee that new technologies and products will disrupt incumbents, just as there is no certainty that existing companies must be disrupted. Instead, product leaders look to patterns, and model their choices in an effort to create a new path.
Source,
https://a16z.com/2014/01/14/the-four-stages-of-disruption/

Key SaaS Metrics for Investors: Customer Acquisition Cost (CAC) & Customer Lifetime Value (CLTV)

To grow customer base or to grab market share Customer Acquisition Cost (CAC) & Customer Lifetime Value (CLTV) are the two important metrics for investors to judge a company based on profitability.
Customer Acquisition Cost (CAC) is associated with Total sales and marketing expenses associated with gaining a new customer and making incremental gross profit from new customer.
CAC matters in,
The path to profitability for Equity investor(VCs) and retail investors is that how quickly a new customer can increase profits and the growth potential is that how quickly a start-up can grow after an inflow of funds after considering CAC.
Also it provides downside protection to traditional lenders and lighter capital who want to know how much spending are done on acquiring new customer.
CAC Ratio = Annualized Gross Profit for period Q
Sales and Marketing Expenses for period Q

Customer Lifetime Value (CLTV) is an estimate of the total amount revenue one can expect of an average customer. As the name implies, CLTV measures the value over the entire lifetime of a customer.
CLTV matters in,
The path to profitability for Equity investor(VCs) and retail investors who want to know the value of newly acquired customer. It also helps in pricing mechanism like Loan to value how long it will take to repay additional loan taken for increase revenue from customers.
CLTV = Average Revenue Per Account (ARPC) x Average Customer lifetime
Lets take example of Netflix,
Netflix has four different types of pricing option for subscribers. Lets take basic and premium one. The basic user charges are ₹199 and premium user charges are ₹799. And they have 1000 subscribers in both cases for example. Average customer lifetime varies by pricing plan.
Average Customer Lifetime
Basic: 6 months
Premium: 12 months
CLTV = Average Revenue Per Account (ARPC) x Average Customer lifetime
= [( ₹199 x 1,000 x 6/12) + ( ₹799 x 1,000 x 12/12)]
2000
= ₹450
This means that, on average, Netflix Company can expect to generate ₹5,391 in revenue per customer.
What is CLTV to CAC Ratio?
The CLTV to CAC Ratio is the total average value you expect to receive from a new customer compared to the average cost to acquire a new customer.
CLTV: Customer Lifetime Value
CAC: Customer Acquisition Cost
In case of start-ups CLTV below CAC is manageable but after certain point in time it has to be above CAC to sustain or become profitable business.
CLTV to CAC Ratio matters in,
The main purpose of this ratio is to check that company is not spending more on acquiring new customer than they are worth of bottom line. A low ratio means company is spending more on acquiring customer and not efficient to make enough revenue from customer. And a high ratio means company can grow with low spending on customer acquisition.
CLTV to CAC Ratio = CLTV / CAC
Source,
https://www.lightercapital.com/blog/how-to-chart-a-path-to-profitability/

Great Products vs. Great Businesses:

– Morgan Housel

Morgan Housel is a partner at The Collaborative Fund and a former columnist at The Motley Fool and The Wall Street Journal. He is a two-time winner of the Best in Business Award from the Society of American Business Editors and Writers, winner of the New York Times Sidney Award. He states, ”the gap between a great product and a great business can be ten miles wide”. We need to understand that a great product does not always make a great business. Every great business is backed by a great product, not every great product turns into a great business. Mark Zuckerberg was asked by a friend whether he thought his social network would make money. He knew how to make a product not to run business. But after that Facebook hit the market and was successful . It is very rare case in today’s world.
Let us understand product and business,
A product is something that solves someone’s problem or provide utility to a consumer.
A business is a product that works so well that people will pay more than it costs to produce and retain to it.

A product can be a great product only if the products manages to pass all the above stages. This is all about a great product but what about great busniess model?
There are two types of loses company makes one is to build a infrastucture to attract more customer and one is that the prices are not paid by customer of what business has paid. One mistake everyone does that they just focus on product development they just do Research & Development process but they do not focus on business model to build a competitive business. It is not wrong to focus on product but one should always focus on business model simultaneously.
While building a business model one should have a mindset to make a sustainable model that should run and make profits for generations. Not only profits are important but customer retention and customer attraction to a product is also important.
Venture capital ideas has also changed, Companies are staying private and making profitable cash flows and a competitive business model before going public so that get a boom in market. When Facebook went public, it said, “Simply put: we don’t build services to make money; we make money to build better services.”
Source,
https://www.collaborativefund.com/blog/great-products-vs-great-businesses/

What Is a Tech Company?

For most of people a tech company is a company that uses software to run the business or uses computers, no this is not the right meaning of tech company.
The definition used for a ‘digital tech business’ is a “business that provides a digital technical service/product/platform/hardware, or heavily relies on it, as its primary revenue source.” But when you ask around, and you’ll find people attached to all sorts of different ideas of what a ‘tech company’ is.
It’s fashionable for companies to market themselves as ‘tech. It’s a way of implying your company is at the forefront of innovation without necessarily having to innovate. But in the early years Tech company were referred to a company that were using computer and computer application/software in their business. The perception of meaning of tech company is changing.
Fifty years ago, the only company was a tech company was IBM a leader in operating system and applications and services. IBM has provided service to many industries like Financial services, manufacturers, retailers, etc. Functions like accounting, resource management, and record-keeping automated and centralized activities that used to be done by man power. With the help of this softwares the efficiency has increases over time in working model.
In 1980 International Business Machines Corporation (IBM) asked Microsoft to produce the essential software, or operating system, for its first personal computer, the IBM PC. Microsoft purchased an operating system from another company, modified it, and renamed it MS-DOS (Microsoft Disk Operating System). MS-DOS was released with the IBM PC in 1981. Thereafter, most manufacturers of personal computers licensed MS-DOS as their operating system, generating vast revenues for Microsoft; by the early 1990s it had sold more than 100 million copies of the program.
Software companies had very huge capital requirement for the initial stage development cost and later on the there is negligible cost to manufacture the chip or provide service to a customer. By the time Microsoft was providing essential software to IBM they also created Windows model privately. In the year 1980 Microsoft got its first license as software company. Microsoft products had to actually be installed in the first place but after than salesforce came into tech world and created comfort for the customer. Salesforce would simply run one piece of software and give anyone anywhere access to it through their own servers.
Microsoft has changed its revenue model. From traditional model to a subscription based model, single-transaction revenue to a recurring revenue stream. It’s a new way of thinking and one that will increase the profitability of each of your customers for years. Subscription business model has outperformed the tradition model because customer purchase services on regular basis as they feel they are more convenient using this model. The company can even forecast their earnings in the new model.
Customers expect more and more from tech companies by the day, and are willing to pay a premium to those providers who deliver continuous value. They care deeply about their experiences with brands. In fact, American Express found that half of customers will consider switching companies after just one poor experience. In the traditional model of single-contact selling, there are fewer opportunities to deliver exceptional experience. The SaaS model, however, relies on delivering value at every touch point in the lifetime of the customer. That’s why Software-as-a-Service (SaaS) companies often experience low churn and high renewal rates, resulting in higher customer lifetime values.


Lets take example of Zoom Video Communications Inc- Listed company in NASDAQ
Zoom is one of the few technology stocks that investors have supported in the past few months while the rest of the market has generally sold off as COVID-19 panic remains. The company’s shares are up 74% this year.

Zoom has created a ecosystem that provides easy-to-use video communications.
It is a Single platform for meetings, phone, webinars & chat, Connect via desktop clients, browsers, conference rooms & mobile devices
Zoom is constantly improving their software and making more convenient for users.

Zoom is able to serve the entire world, giving it maximum leverage.
Zoom Software enables zero transaction costs for basic use and minimal cost for premium users.
Zoom has zero marginal costs.
Customers received value in the form of:
Lower purchase costs
User-friendly, digital deployment
Painless and automatic upgrades
Remote, full-featured applications delivered over the internet
Technology helps in improvement in product. Sustainable technology can be disruptive or can enhance the value of existing product . Products based on disruptive technologies are typically cheaper, simpler, smaller, and, frequently, more convenient to use.
Source,
https://stratechery.com/2019/what-is-a-tech-company/

Why Software is eating the world?

It is clear to see how software is shaping multiple industries and everyday lives. Software is eating the world. This is the thought of Marc Andreessen when he wrote up his thoughts on how the world is changing. Highlighting how the world was past the ‘dot-com bubble’ of the 90s, Marc discussed how we were seeing a new bubble was upon us, a software revolution -from the Silicon Valley, California.
Silicon Valley in California is world-renowned, if not most of Earth’s “technology district” – housing companies from start-ups to well-established household names such as Google, Facebook, Microsoft and more. These companies are the ones dominating the world economy.
Ask your parents how they used to send messages or do shopping. They had to visit a post office to write a letter and courier it to another person but now with the help of whatsapp a software by just one click the message gets delivered in seconds, Similarly to buy any furniture or electrical appliances, etc they had to visit shopping centres but now with the help of E-commerce platform such a Amazon one can buy anything, anywhere, anytime with just a click. This much software has developed over the years.
Why Software is eating the world?
The article points towards a shift in the way companies are running, reducing the use of man-power to software that automates and can efficiently do the work, reducing overheads while maintaining the ability to remain efficient. In the case of expansion or changes to business methods, all it takes is a software update to alter in the software and the system functions automatically. Companies are testing applications in form of BETA apps and software models designed to help them run more efficiently. Before 10 years ago , the physical presence was give more priority even when technology was in place but now companies are cutting middle man out to reduce their workforce. But in today’s world the presence of software is given more importance.
Software companies has shown tremendous growth in today’s world. Software isn’t just beneficial to the operational/manufacturing side of a business. It’s also beneficial to head office divisions in order to stay on top of figures and production, the data side of a company sensing any patterns in the software or opportunities on certain data points. This follows through to marketing who can work with this data and of course work effectively and efficiently who are able to access data live themselves in order to be aware of what is going in a company. In tech-world company one has to re-build their MOAT. Because every other day one tries to compete another so to be in the business on has to update their software as per the new trend in the market.
In a world dominated by digital transformation, leaders should understand that operating with the old mindset will not help their companies face customer behaviour changes or new types of competition.
The Rise of Software Companies:
Amazon- a $1.7 trillion company-The famous book seller became a software company. Amazon offerings include their Prime video and audio libraries, multiple apps as well as other services such as Prime delivery, Amazon Kindle and of course – their retail website . However, the main reason Amazon is seen as a software company is mainly because of their lesser-known commercial products, but an industry-renowned tool of Amazon Web Services (AWS). Loudcloud, the cost of a customer running a basic Internet application was approximately $150,000 a month. Running that same application today in Amazon’s cloud costs about $1,500 a month.
-Today’s largest video service by number of subscribers is a software company. Netflix has changed the way of content streaming many data cable service providers disrupted , Whatsapp for messages & videocall , LinkedIn for job profile and recruiting, dominant music companies too: Apple’s iTunes, Spotify .

Leading world retailer, Wal-Mart, uses software to power its logistics and distribution capabilities, which it has used to crush its competition. Likewise for FedEx, which is best thought of as a software network that happens to have trucks, planes and distribution hubs attached . By the use of software they can optimize routes to reduce their cost to most possible.

Oil and gas companies also uses software for exploration by the help of visualization and analysis. Agriculture is increasingly powered by software as well, including satellite analysis of soils linked to per-acre seed selection software algorithms . Electronic arts (EA) is a software company developing games like Cricket , FIFA . 3D printing technology is disrupting the traditional manufacturing industry.

This article concludes that software companies are future and there is potential growth in software companies. This change has made people to enhance their abitilites in coming future in order to compete.

Source,
https://a16z.com/2011/08/20/why-software-is-eating-the-world/

Archegos’s margin call:

There’s this man named Bill Hwang. He is a Tiger cub, having worked for the hedge fund named Tiger, run by Julian Robertson. Hwang runs New York based Archegos Capital.
Archegos was a family office of Hwang, and runs capital of around $10 billion. But the real exposure was much more. What Hwang did, it seems, was that he didn’t buy stocks directly – he bought a certain “derivative” instrument called a Contract for Difference (CFD). there are no securities filings by Archegos on SEC’s repository for such filings, EDGAR (Electronic Data Gathering, Analysis, and Retrieval), despite the huge transactions undertaken by Archegos.
In a CFD, you deal with a bank and say, “listen, if the stock goes up, you pay me the difference, and if it goes down, I’ll pay the difference”. The bank then takes the underlying position in your name, and hedges out the risk. The stock is held by the bank, not in your name.
Effectively, Hwang could build large positions in certain stocks without revealing that he owned those position. If he had bought stock directly, anything above 5% had to be reported. But it wasn’t because of the CFD trick. Hwang had $10 billion. His positions were $50 billion.
The 5x multiple was “leverage”, offered by large banks such as Nomura, Credit Suisse, Morgan Stanley and Goldman. He’d put his $1 and they’d lend him $4 against the security of the very stocks he would buy through a CFD. All it took was for Hwang to ensure that he paid up if the stocks fell down. The problem, of course, arises when the bet goes spectacularly wrong and the share price falls instead of rising. And the stocks kept going up rapidly in 2021, with once of them – ViacomCBS – moving from $36 to $100 between the start of 2021 to March 22.to buy more of these stocks, such as Viacom and Discovery. He also owned shares of Baidu, Tencent and a bunch of Chinese tech companies.
Viacom between March 23 and 24, the stock fell from $100 to $67. A 33% fall in three days. Now think of this:
You have $100 multiplied to $500 by leverage offered by the banks.
You own $500 worth of Viacom, but not in your own name – as a CFD. So the shares are owned by the banks and kept as collateral.
The stock falls 33%.
Effectively you’ve lost $150.
You owned only $100 in the first place
The bank says give me the extra 50 and then some more to cover for volatility.
You don’t have it.
The bank panics and starts selling the stock like crazy. That’s exactly what happened to Archegos.
Archegos was forced to unload $20 billion of shares following its inability to meet margin obligations to brokers on 26th March 2021. The led to prices of stocks like ViacomCBS and In just four days, ViacomCBS lost more than half its market value, Discovery crash and US-listed shares of China-based Baidu and Tencent Music plunging 33-48 percent.
Not surprisingly, one of the big lessons for bankers from the Archegos meltdown is that prime brokerage is a lot more risky than they assumed. In a low-interest-rate environment bankers are easily attracted by the chance of earning lucrative fees. It’s very clear that bankers were very eager to do business with Archegos, and they weren’t focusing on the potential risks. Banks were in thinking that they are the only one to give huge funds to them but Archegos had taken leverage from others banks also. Archegos isn’t the biggest unwinding the market has seen, so we’ll just have to wait to see who else gets hit.